

Bitcoin price traded to a new monthly high at $21,469 before it started a downside correction. BTC could drop towards $20,600 before it starts a fresh increase.
- Bitcoin gained pace above the $21,000 resistance zone before it faced sellers.
- The price is trading above $20,500 and the 100 hourly simple moving average.
- There is a key bearish trend line forming with resistance near $21,150 on the hourly chart of the BTC/USD pair (data feed from Kraken).
- The pair could a fresh increase if it clears the $21,150 and $21,400 resistance levels.
Bitcoin Price Corrects Lower
Bitcoin price remained well bid above the $20,600 and $20,500 levels. BTC gained pace for a move above the $21,000 resistance zone and a close above the 100 hourly simple moving average.
The price even moved above the $21,200 level. A high was formed near $21,469 before the bulls lost control. Recently, there was a downside correction below the $21,200 level. The price declined below the 23.6% Fib retracement level of the upward move from the $20,050 swing low to $21,469 high.
However, the bulls were active near the $20,900 zone and the 100 hourly simple moving average. Bitcoin price is now trading above $20,500 and the 100 hourly simple moving average.
On the upside, an immediate resistance is near the $21,050 level. The first major resistance is near the $21,150 level. There is also a key bearish trend line forming with resistance near $21,150 on the hourly chart of the BTC/USD pair.
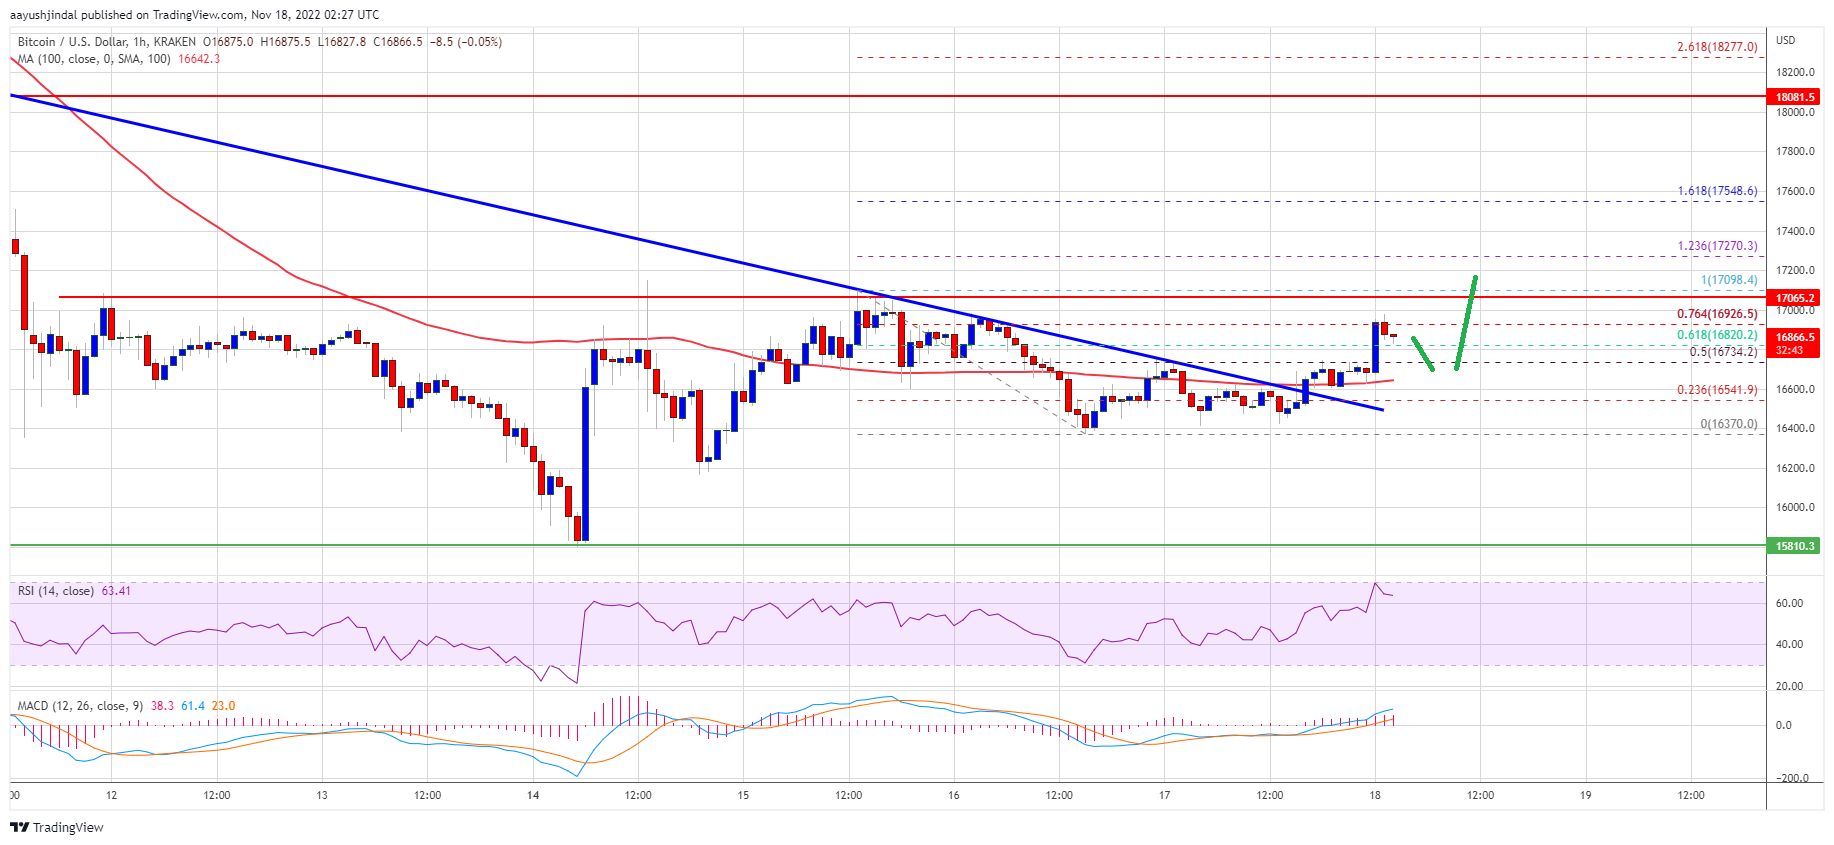
Source: BTCUSD on TradingView.com
A clear move above the trend line resistance and $21,200 might send the price towards $21,500. The next major resistance is near $22,000, above which the price may perhaps rise towards the $22,500 zone.
More Losses in BTC?
If bitcoin fails to clear above the $21,150 resistance zone, it could resume its decline. An immediate support on the downside is near the $20,850 zone and 100 hourly simple moving average.
The next major support is near the $20,600 zone. A clear move below the $20,600 support might push the price further lower. In this case, the price may perhaps decline towards the $20,200 level.
Technical indicators:
Hourly MACD – The MACD is now gaining pace in the bearish zone.
Hourly RSI (Relative Strength Index) – The RSI for BTC/USD is now below the 50 level.
Major Support Levels – $20,600, followed by $20,200.
Major Resistance Levels – $21,150, $21,400 and $22,000.