

Ethereum started a downside correction from the $1,675 high against the US Dollar. ETH must stay above the $1,550 support to start a fresh increase.
- Ethereum climbed higher above $1,650 before it started a downside correction.
- The price is now trading below $1,600 and the 100 hourly simple moving average.
- There is a key bearish trend line forming with resistance near $1,605 on the hourly chart of ETH/USD (data feed via Kraken).
- The pair could rise steadily if it clears the $1,600 and $1,615 resistance levels.
Ethereum Price Corrects Lower
Ethereum remained well bid above the $1,550 support zone. ETH started a fresh increase and was able to clear the $1,600 resistance zone and the 100 hourly simple moving average.
The price even broke the $1,650 level, but there was no test of $1,700. A high was formed near $1,675 and the price started a downside correction. There was a move below the $1,620 and $1,600 level. Ether price declined below the 50% Fib retracement level of the upward move from the $1,501 swing low to $1,675 high.
The price tested the $1,560 support zone. It stayed above the 61.8% Fib retracement level of the upward move from the $1,501 swing low to $1,675 high.
Ether is now consolidating losses below $1,600 and the 100 hourly simple moving average. An immediate resistance on the upside is near the $1,600 level. There is also a key bearish trend line forming with resistance near $1,605 on the hourly chart of ETH/USD.
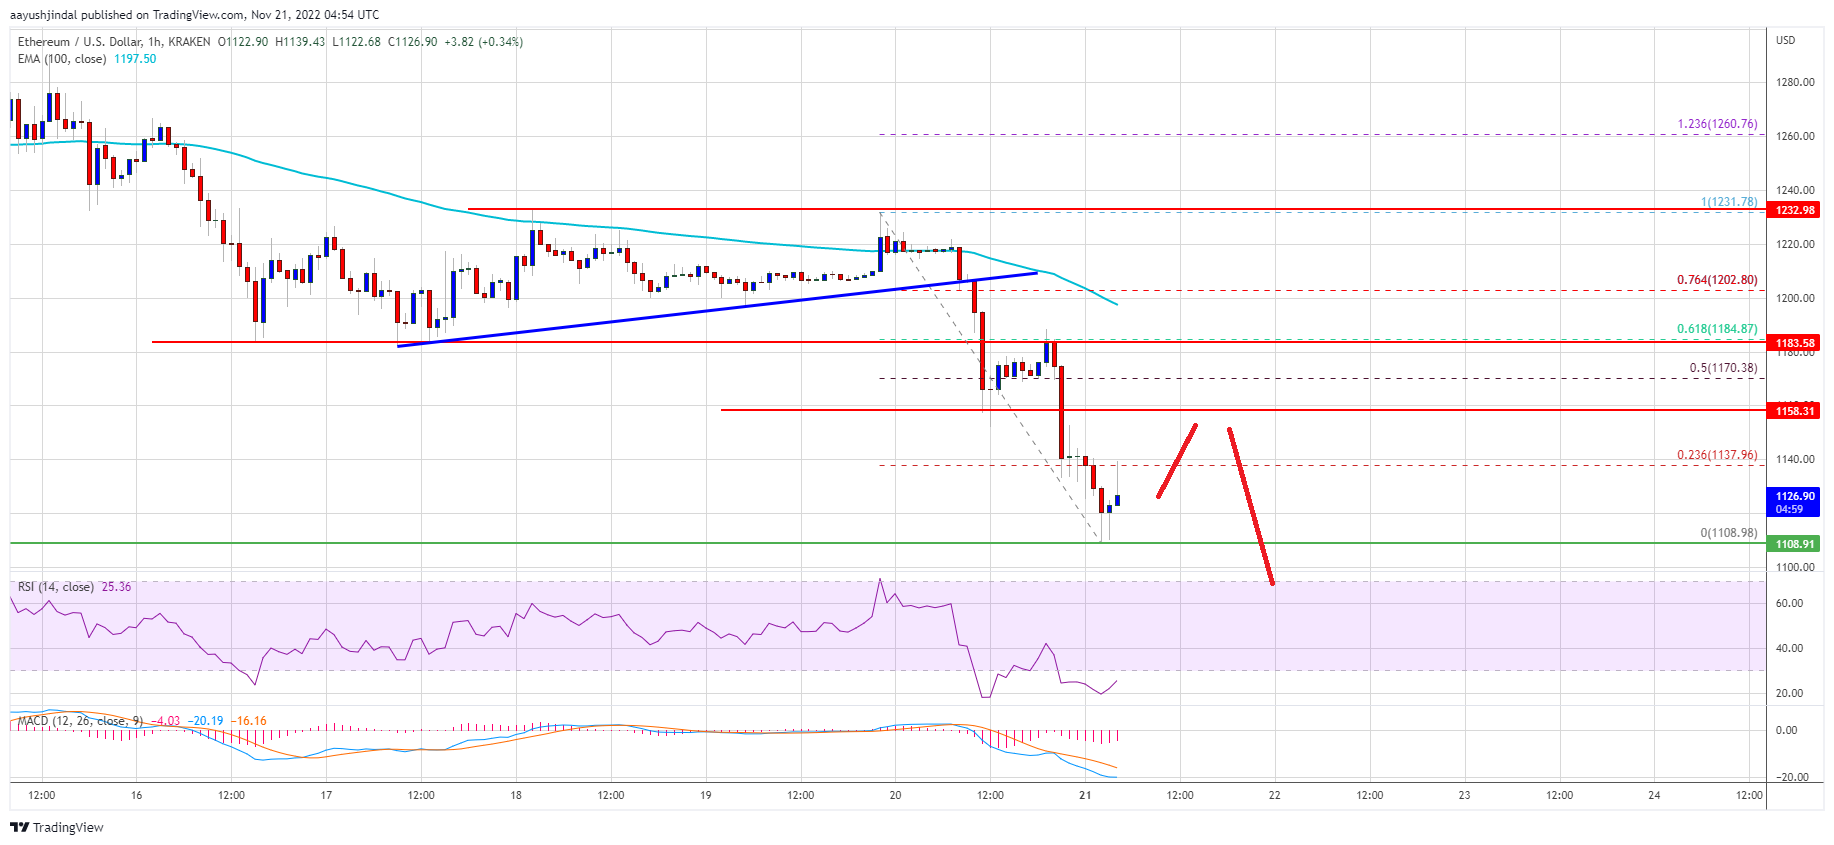
Source: ETHUSD on TradingView.com
The next major resistance is near the $1,615 level. A clear break above the $1,615 resistance could set the pace for a decent increase. In the stated case, the price could rise to the $1,675 level. Any more gains might send the price toward the $1,720 resistance zone.
More Losses in ETH?
If ethereum fails to climb above the $1,615 resistance, it could start another decline. An initial support on the downside is near the $1,560 level.
The next major support is near the $1,550 level, below which ether price may perhaps gain bearish momentum. In the stated scenario, the price could decline towards the $1,500 support zone in the near term.
Technical Indicators
Hourly MACD – The MACD for ETH/USD is now losing momentum in the bearish zone.
Hourly RSI – The RSI for ETH/USD is now below the 50 level.
Major Support Level – $1,560
Major Resistance Level – $1,615