

Ripple is rising steadily above the $0.380 resistance zone against the US Dollar. XRP price could rise further if it clears the $0.4320 resistance zone.
- Ripple is currently rising above the $0.38 resistance zone against the US dollar.
- The price is now trading above $0.380 and the 100 simple moving average (4-hours).
- There is a key bullish trend line forming with support near $0.3960 on the 4-hours chart of the XRP/USD pair (data source from Kraken).
- The pair could rally further if there is a clear move above the $0.4320 resistance zone.
Ripple Price Starts Steady Increase
After forming a base above $0.32, ripple’s XRP started a steady increase against the US Dollar. The price climbed above the $0.35 resistance zone to move into a positive zone.
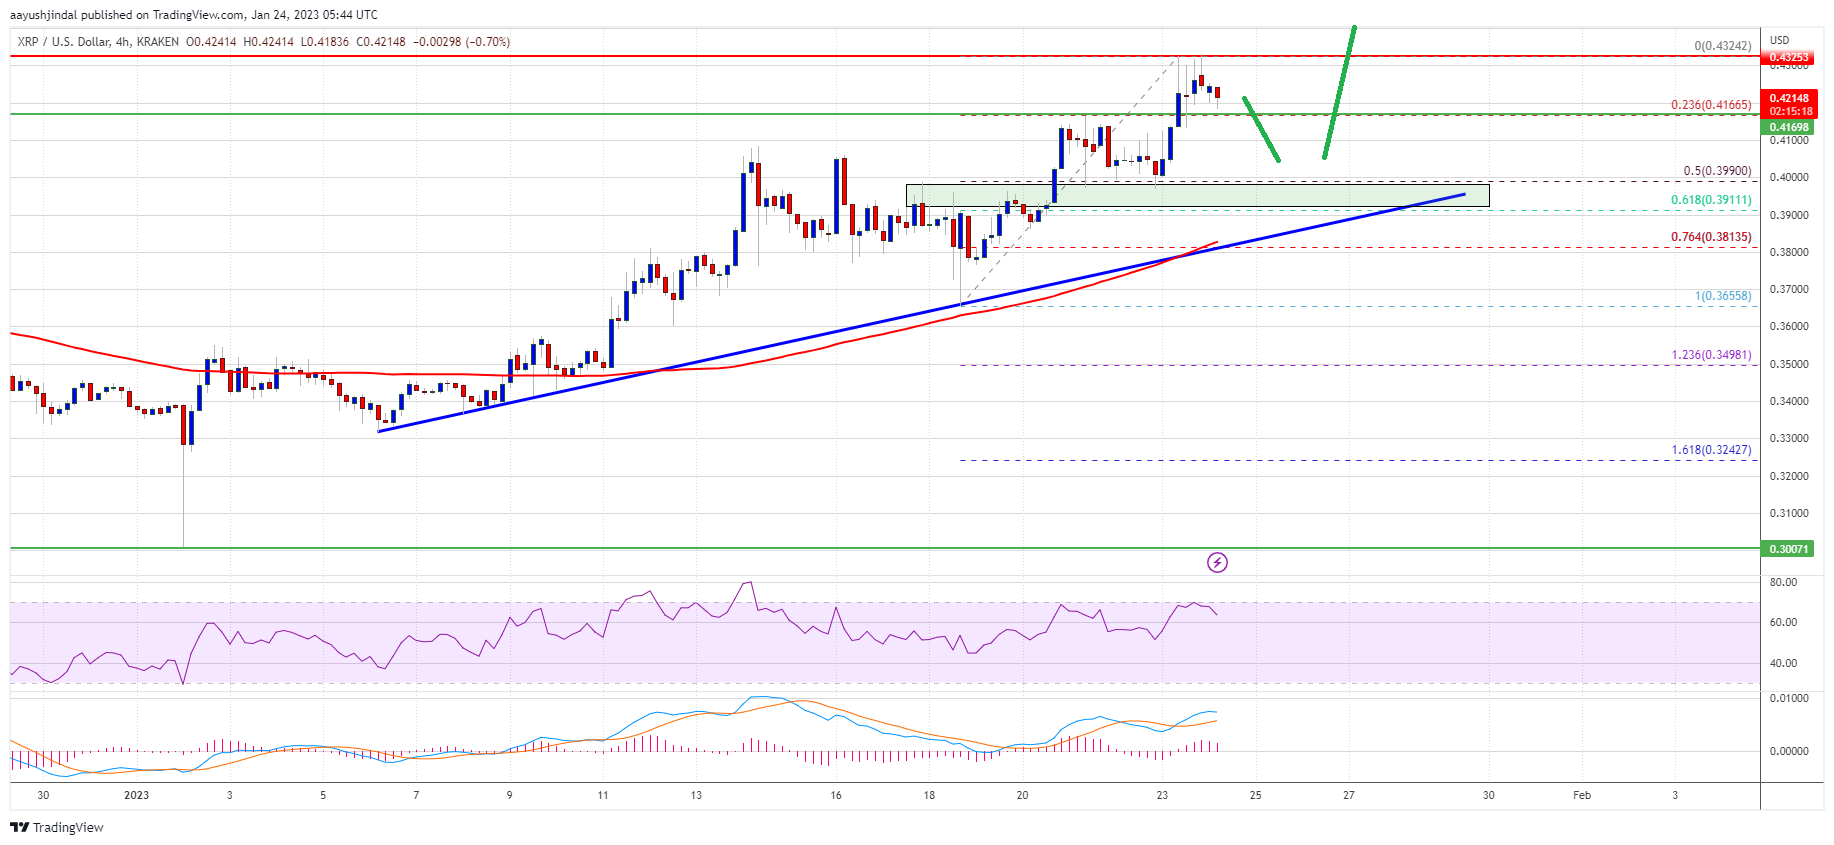
The bulls pushed the price above the $0.365 level and the 100 simple moving average (4-hours). The increase was such that xrp price even surged above the $0.40 level. It traded to a new yearly high at $0.4324 and is currently consolidating gains, similar to bitcoin.
The price is now trading above $0.380 and the 100 simple moving average (4-hours). There is also a key bullish trend line forming with support near $0.3960 on the 4-hours chart of the XRP/USD pair. The pair is stable above the 23.6% Fib retracement level of the upward move from the $0.3655 swing low to $0.4324 high.
Source: XRPUSD on TradingView.com
An immediate resistance is near the $0.432 zone. The next key resistance is near the $0.45 level. A successful break above the $0.450 resistance might send the price towards the $0.480 resistance. Any more gains might send the price towards the $0.50 level in the coming sessions.
Dips Limited in XRP?
If ripple fails to clear the $0.432 resistance zone, it could start a downside correction. An initial support on the downside is near the $0.416 level.
The next major support is near $0.400 and the trend line. It is close to the 50% Fib retracement level of the upward move from the $0.3655 swing low to $0.4324 high. If there is a downside break and close below the $0.40 level, xrp price could extend losses. In the stated case, the price could even decline below the $0.365 support.
Technical Indicators
4-Hours MACD – The MACD for XRP/USD is now gaining pace in the bullish zone.
4-Hours RSI (Relative Strength Index) – The RSI for XRP/USD is now above the 50 level.
Major Support Levels – $0.416, $0.400 and $0.392.
Major Resistance Levels – $0.432, $0.450 and $0.480.