

Ethereum is consolidating gains above $1,600 against the US Dollar. ETH is showing positive signs and might start another increase above $1,650.
- Ethereum is showing positive signs above the $1,620 and $1,600 levels.
- The price is now trading above $1,600 and the 100 hourly simple moving average.
- There is a key bullish flag forming with resistance near $1,640 on the hourly chart of ETH/USD (data feed via Kraken).
- The pair could rally again if it clears the $1,640 and $1,650 resistance levels.
Ethereum Price Could Pop Higher
Ethereum price started a downside correction from the $1,680 resistance zone. ETH corrected lower below the $1,650 and $1,620 level, similar to bitcoin.
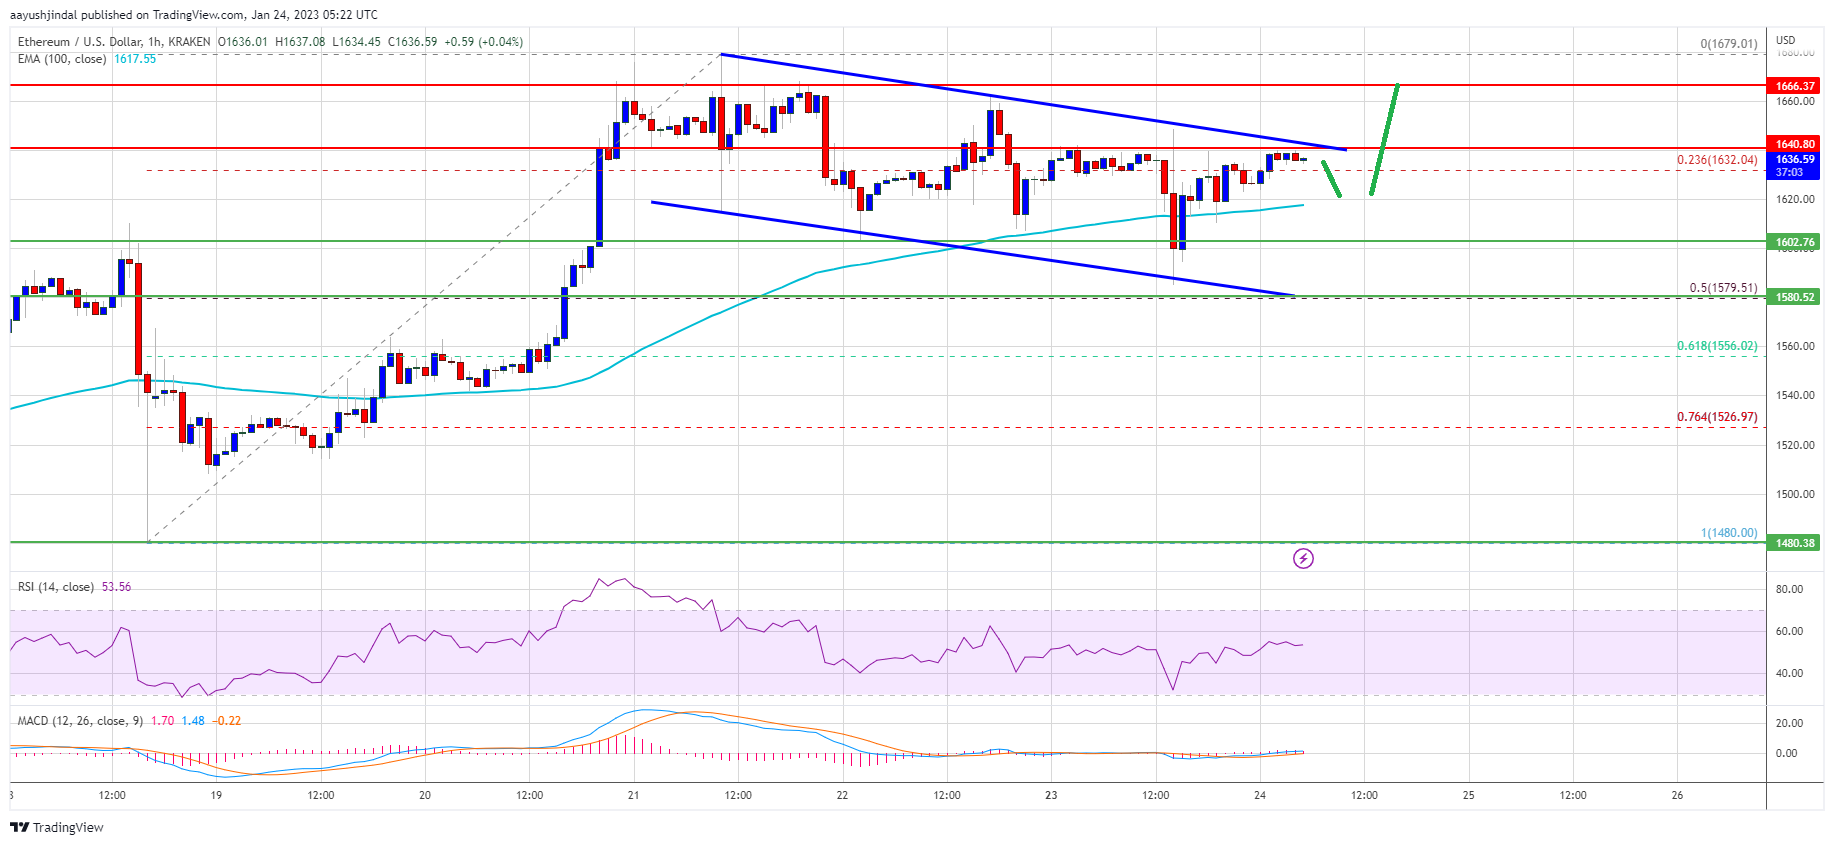
The price declined below the 23.6% Fib retracement level of the upward wave from the $1,481 swing low to $1,680 high. There was a sharp decline below the $1,620 level and the 100 hourly simple moving average. However, the price remained stable near the $1,600 level.
Ether price is now trading above $1,600 and the 100 hourly simple moving average. There is also a key bullish flag forming with resistance near $1,640 on the hourly chart of ETH/USD.
Source: ETHUSD on TradingView.com
An immediate resistance is near the $1,640 level and the channel resistance. The next major resistance is near the $1,665 level. An upside break above the $1,665 resistance zone could start a fresh rally. In the stated case, the price may perhaps rise towards the $1,720 resistance. Any more gains might send the price towards $1,800 or even $1,850 in the near term.
Dips Supported in ETH?
If ethereum fails to clear the $1,640 resistance, it could start another downside correction. An initial support on the downside is near the $1,620 level and the 100 hourly SMA.
The next major support is near the $1,580 level or the 50% Fib retracement level of the upward wave from the $1,481 swing low to $1,680 high. If there is a break below $1,580, the price might drop towards the $1,520 support. Any more losses might call for a test of the $1,500 zone.
Technical Indicators
Hourly MACD – The MACD for ETH/USD is now gaining momentum in the bullish zone.
Hourly RSI – The RSI for ETH/USD is now above the 50 level.
Major Support Level – $1,580
Major Resistance Level – $1,640