

Litecoin price remained well bid above the $60 support zone against the US Dollar. LTC is rising and might attempt a fresh rally above the $70 level.
- Litecoin started a fresh decline below $80 support against the US Dollar.
- The price is now trading below $70 and the 100 simple moving average (4-hours).
- There is a key bearish trend line forming with resistance near $70.50 on the 4-hours chart of the LTC/USD pair (data feed from Kraken).
- The price could start a decent increase if there is a clear move above the $72 resistance.
Litecoin Price Eyes Upside Break
Earlier this month, litecoin price saw a steady decline from well above the $80 level against the US Dollar. LTC price declined below the $75 support zone to move into a bearish zone, similar to bitcoin and ethereum.
The price gained pace below the $70 support and the 100 simple moving average (4-hours). A low was formed near $61.02 and the price is now attempting a recovery wave. There was a decent upside correction above the $63 and $65 levels.
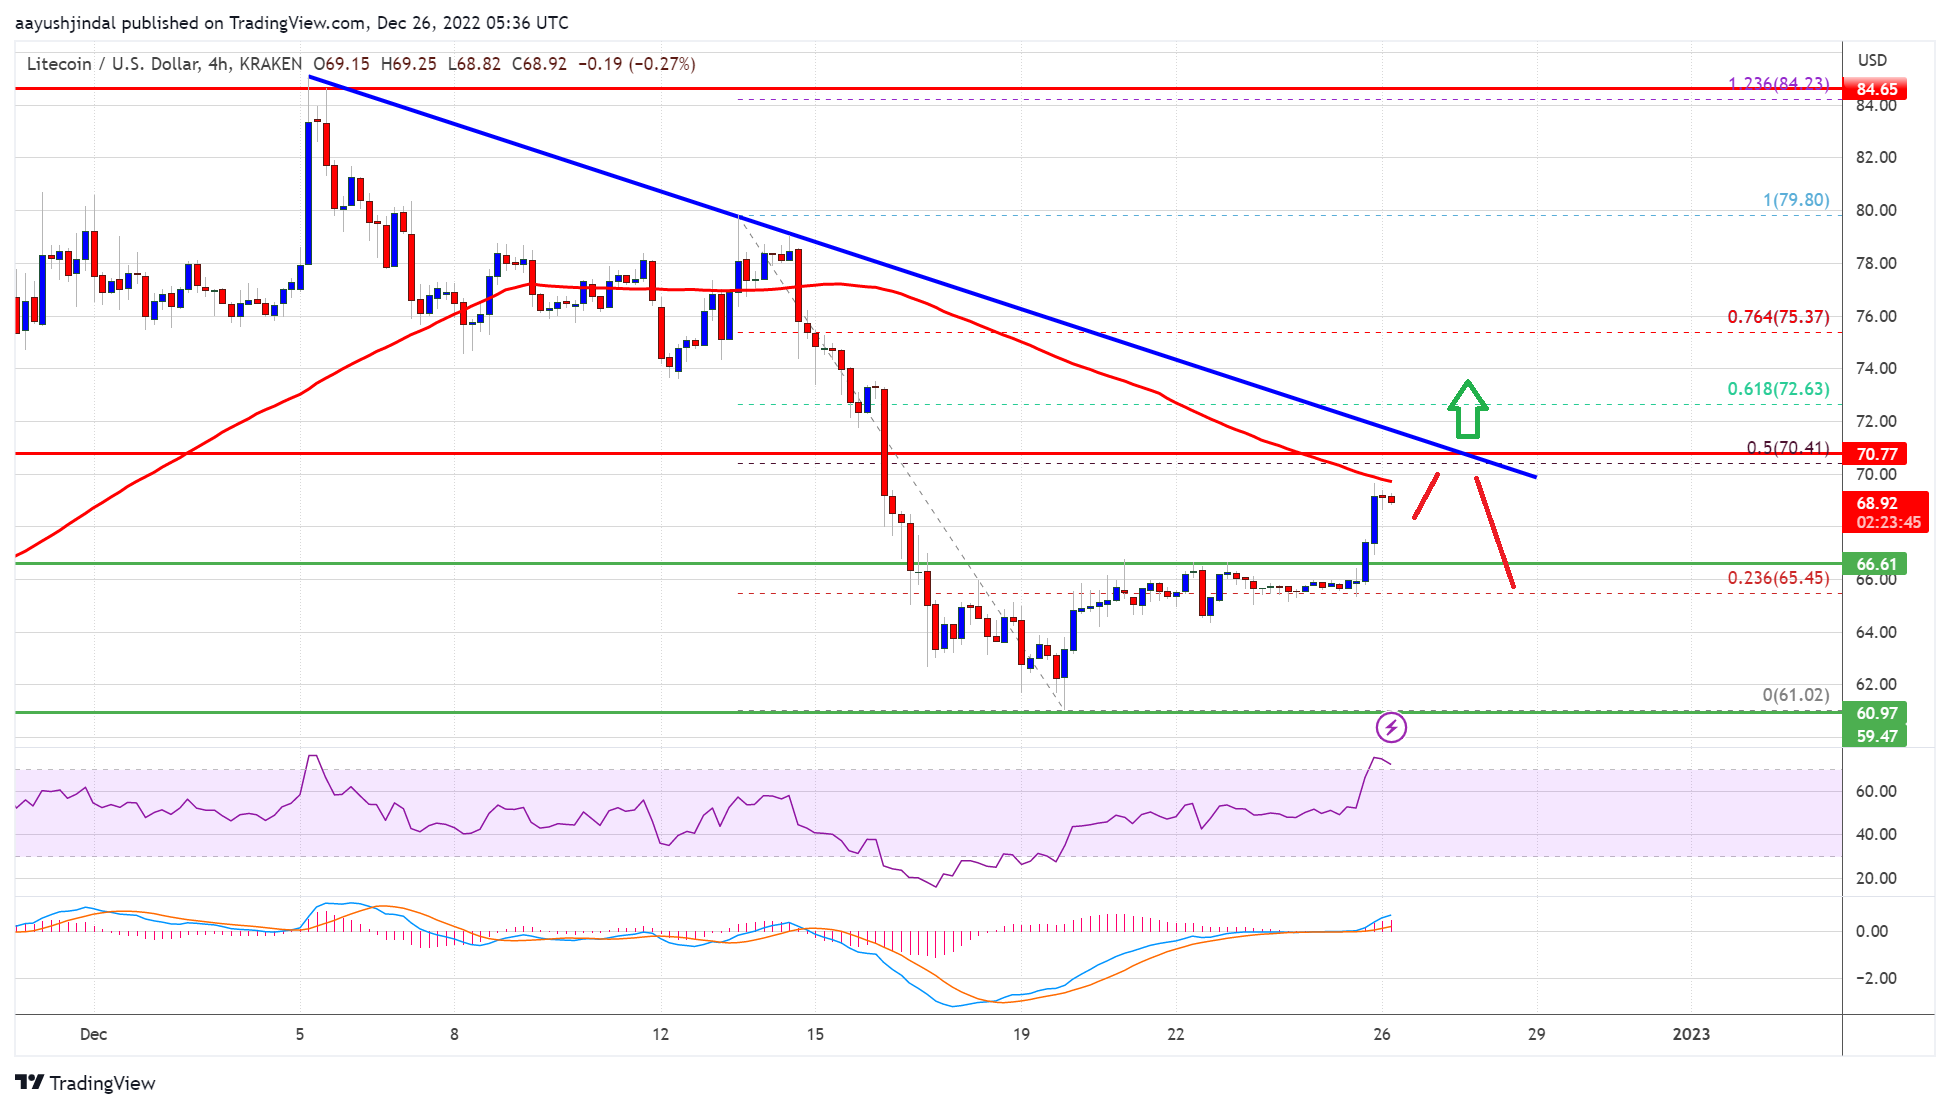
There was a move above the 23.6% Fib retracement level of the key decline from the $79.80 swing high to $61.02 low. The price is now trading near the $70 resistance and 100 simple moving average (4-hours).
On the upside, an immediate resistance is near the $70.00 level. There is also a key bearish trend line forming with resistance near $70.50 on the 4-hours chart of the LTC/USD pair. The trend line is near the 50% Fib retracement level of the key decline from the $79.80 swing high to $61.02 low.
Source: LTCUSD on TradingView.com
If there is a clear break above the $70.50 resistance, the price could start a strong increase. In the stated case, the price is likely to continue higher towards the $72 and $75 levels. Any more gains might send ltc price towards the $80 resistance zone.
Fresh Decline in LTC?
If Litecoin price fails to clear the $70.00 resistance level, there could be a fresh decline. An initial support on the downside is near the $65.50 level.
The first major support is forming near the $64.00 level. Any further losses may perhaps send the price towards the $60.00 support in the coming sessions.
Technical indicators:
4-hours MACD – The MACD is slowly gaining pace in the bullish zone.
4-hours RSI (Relative Strength Index) – The RSI for LTC/USD is above the 50 level.
Major Support Levels – $65.50 followed by $60.00.
Major Resistance Levels – $70.00 and $75.00.