

Ethereum is facing resistance above $1,250 against the US Dollar. ETH could gain bullish momentum if it clears the $1,230 and $1,250 resistance levels.
- Ethereum attempted a recovery wave and climbed above the $1,200 level.
- The price is now trading above $1,200 and the 100 hourly simple moving average.
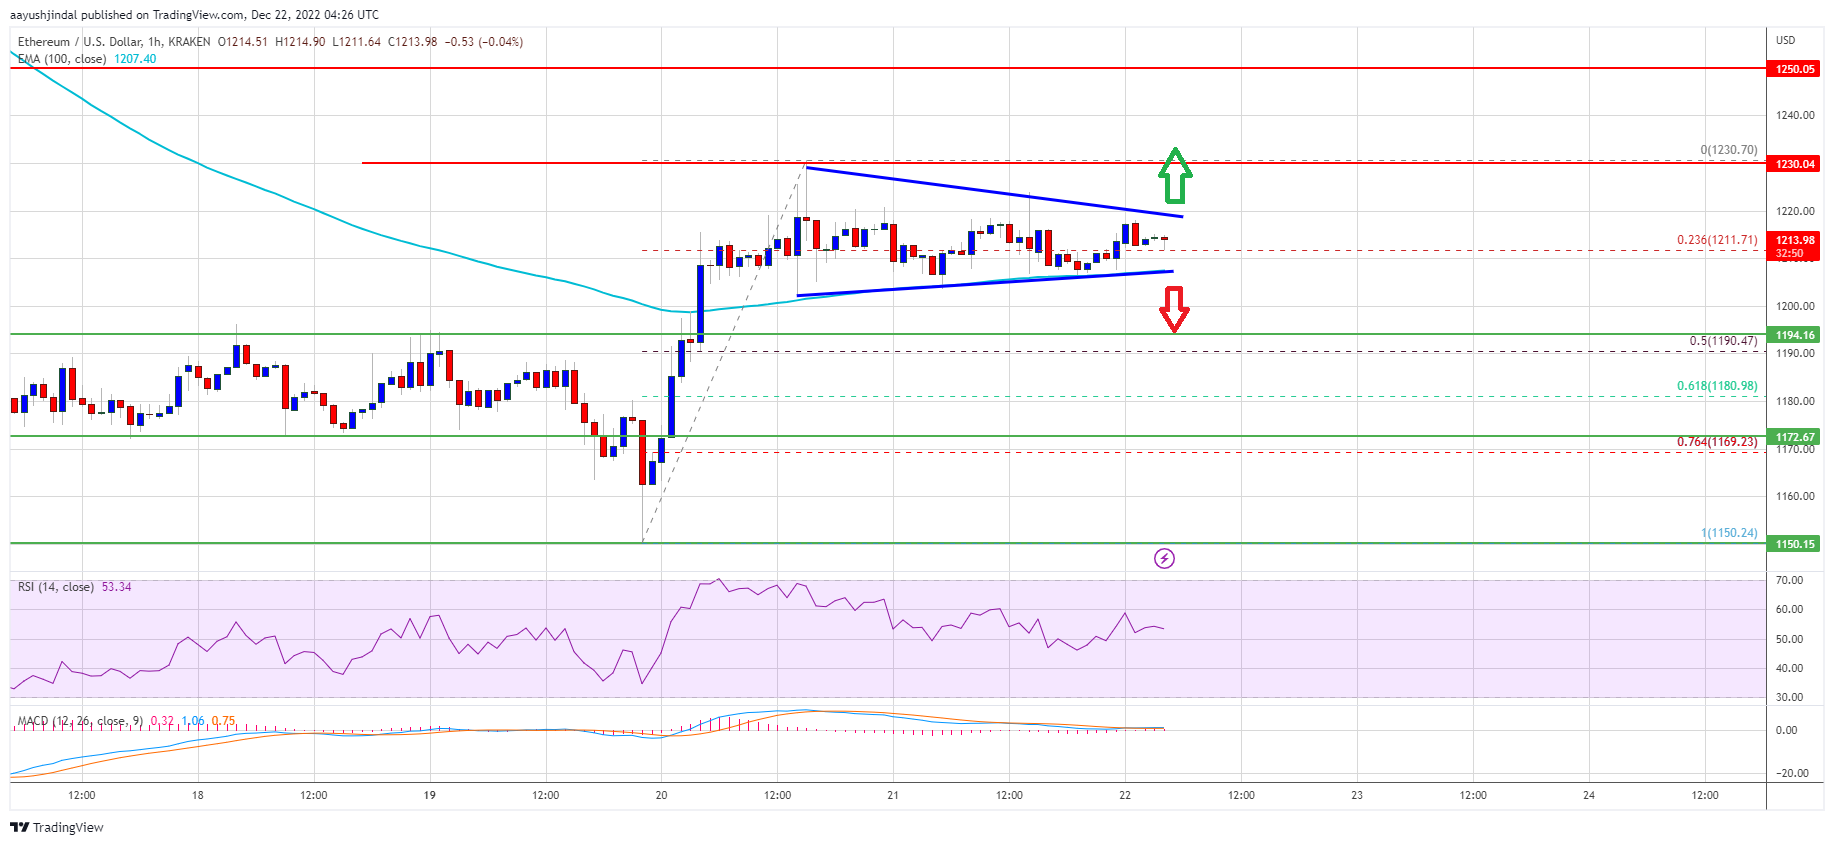
- There is a key contracting triangle forming with resistance near $1,220 on the hourly chart of ETH/USD (data feed via Kraken).
- The pair could a steady increase if there is a clear move above $1,230 and $1,250.
Ethereum Price Eyes Upsides Break
Ethereum price started an upside correction from the $1,150 support zone. ETH was able to climb above the $1,180 and $1,200 levels.
There was a close above the $1,200 level and the 100 hourly simple moving average. Ether price even tested the $1,230 resistance zone. It is now consolidating below the $1,230 level, similar to bitcoin. There was a minor decline below the $1,220 level.
The price declined below 23.6% Fib retracement level of the upward move from the $1,150 swing low to $1,230 high. Ether is now trading above $1,200 and the 100 hourly simple moving average.
An immediate resistance is near the $1,220 level. There is also a key contracting triangle forming with resistance near $1,220 on the hourly chart of ETH/USD. The first major resistance is near the $1,230 level. A clear upside break above the $1,230 resistance could send the price towards the $1,250 resistance.
Source: ETHUSD on TradingView.com
To start a steady increase, the price must settle above the $1,230 and $1,250 levels. The next major resistance could be $1,300. If the bulls clear the $1,300 resistance, the price might rise towards $1,345. Any more gains might send the price towards the $1,400 resistance zone.
Fresh Decrease in ETH?
If ethereum fails to climb above the $1,230 resistance, it could start another drop. An initial support on the downside is near the $1,200 level and the 100 hourly simple moving average.
The next major support is near the $1,190 level. It is close to the 50% Fib retracement level of the upward move from the $1,150 swing low to $1,230 high. A downside break below $1,190 might spark a move towards the $1,150 support. Any more losses could lead the price towards the $1,065 support.
Technical Indicators
Hourly MACD – The MACD for ETH/USD is now slowly gaining momentum in the bullish zone.
Hourly RSI – The RSI for ETH/USD is now above the 50 level.
Major Support Level – $1,190
Major Resistance Level – $1,230