
Ripple is consolidating below the $0.35 resistance zone against the US Dollar. XRP price could extend its decline if there is no recovery wave above the $0.35 barrier.
- Ripple is currently consolidating below the $0.35 and $0.365 levels against the US dollar.
- The price is now trading below $0.365 and the 100 simple moving average (4-hours).
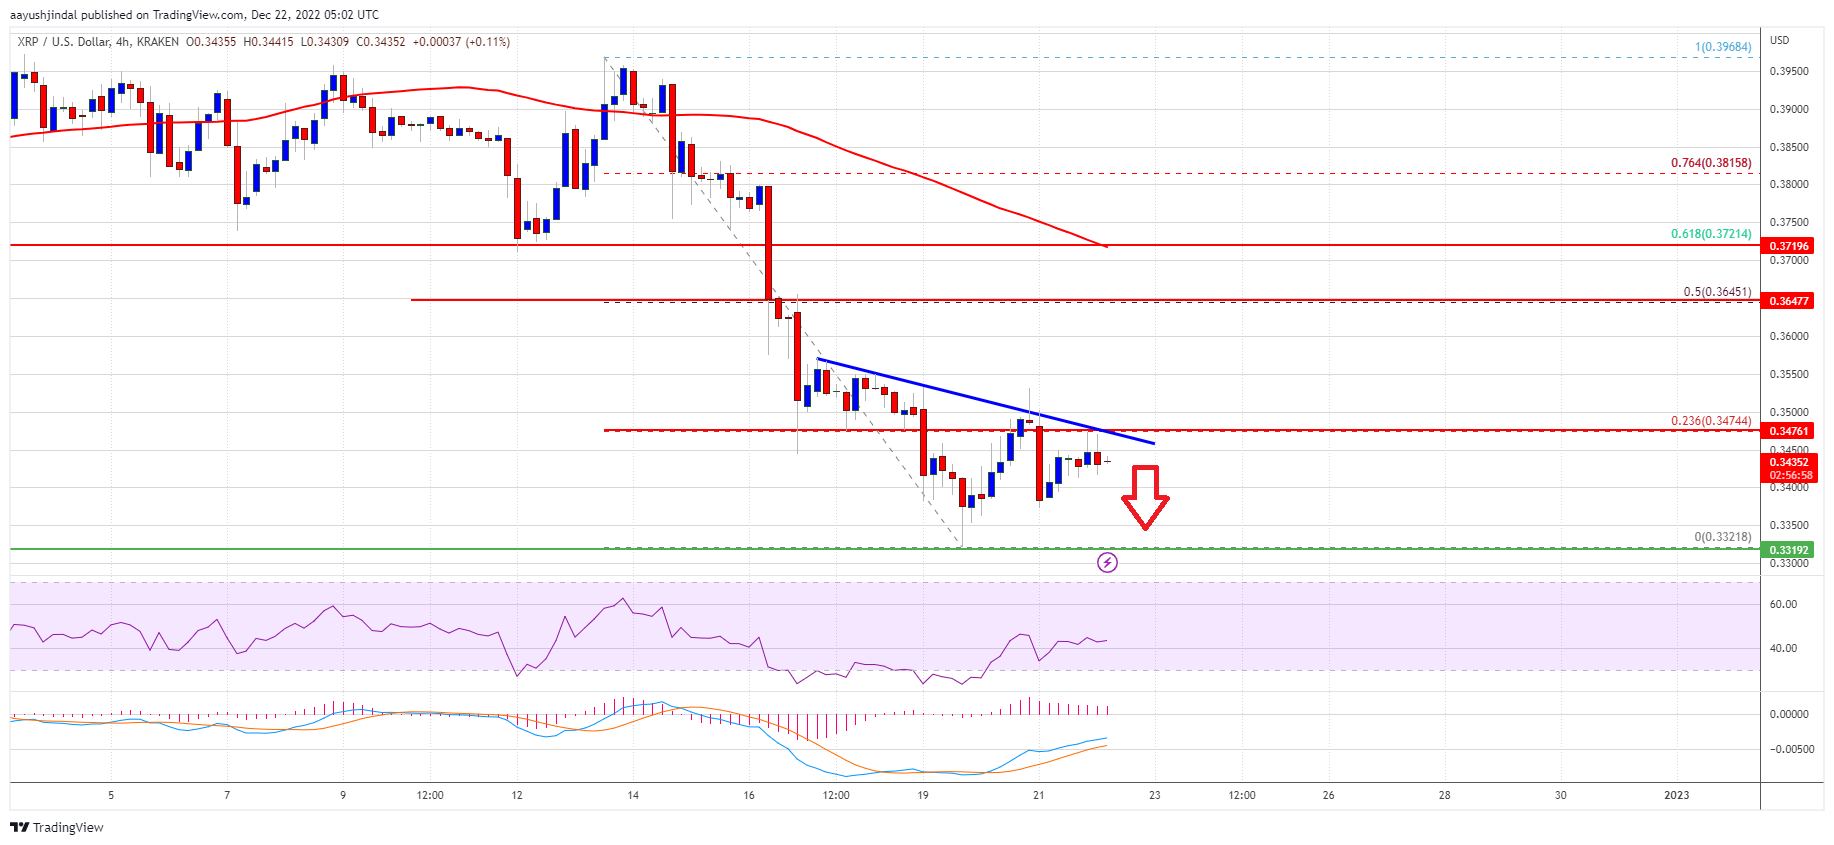
- There is a key bearish trend line forming with resistance near $0.3480 on the 4-hours chart of the XRP/USD pair (data source from Kraken).
- The pair could start a decent recovery if it clears the $0.350 resistance zone.
Ripple Price Faces Resistance
After struggling to clear the $0.40 resistance, ripple’s XRP started a fresh decline against the US Dollar. The price dropped below the $0.380 and $0.365 support levels to move into a bearish zone.
The price gained pace below the $0.35 support and settled below the 100 simple moving average (4-hours). The bulls finally appeared near the $0.332 level. A low is formed near $0.3321 and the price is now consolidating losses, just like bitcoin and ethereum.
Xrp price climbed a few points above the $0.340 level. An immediate resistance is near the $0.350 zone. There is also a key bearish trend line forming with resistance near $0.3480 on the 4-hours chart of the XRP/USD pair. The trend line is close to the 23.6% Fib retracement level of the downward move from the $0.3968 swing high to $0.3321 low.
A successful break above the $0.350 resistance might send the price towards the $0.365 resistance. It is close to the 50% Fib retracement level of the downward move from the $0.3968 swing high to $0.3321 low.
Source: XRPUSD on TradingView.com
The next key resistance is near the $0.372 level and 100 simple moving average (4-hours). Any more gains might send the price towards the $0.40 level in the coming days.
More Downsides in XRP?
If ripple fails to clear the $0.350 resistance zone, it could continue to move down. An initial support on the downside is near the $0.340 level.
The next major support is near $0.332. If there is a downside break and close below the $0.332 level, xrp price could extend losses. In the stated case, the price could even decline below the $0.320 support.
Technical Indicators
4-Hours MACD – The MACD for XRP/USD is now losing pace in the bearish zone.
4-Hours RSI (Relative Strength Index) – The RSI for XRP/USD is now below the 50 level.
Major Support Levels – $0.340, $0.332 and $0.305.
Major Resistance Levels – $0.350, $0.365 and $0.372.