

Dogecoin reacted to the downside from the $0.1120 resistance against the US Dollar. DOGE must stay above the $0.080 support to start a fresh increase.
- DOGE started a fresh decline from the $0.1120 resistance against the US dollar.
- The price is trading below the $0.0950 zone and the 100 simple moving average (4-hours).
- There was a break below a key bullish trend line with support near $0.102 on the 4-hours chart of the DOGE/USD pair (data source from Kraken).
- The pair must stay above the $0.0800 support zone to start a fresh increase.
Dogecoin Price Takes A Hit
In the past few days, dogecoin saw a major decline from the $0.1120 resistance zone. DOGE reacted to the downside below the $0.1050 and $0.1000 support levels.
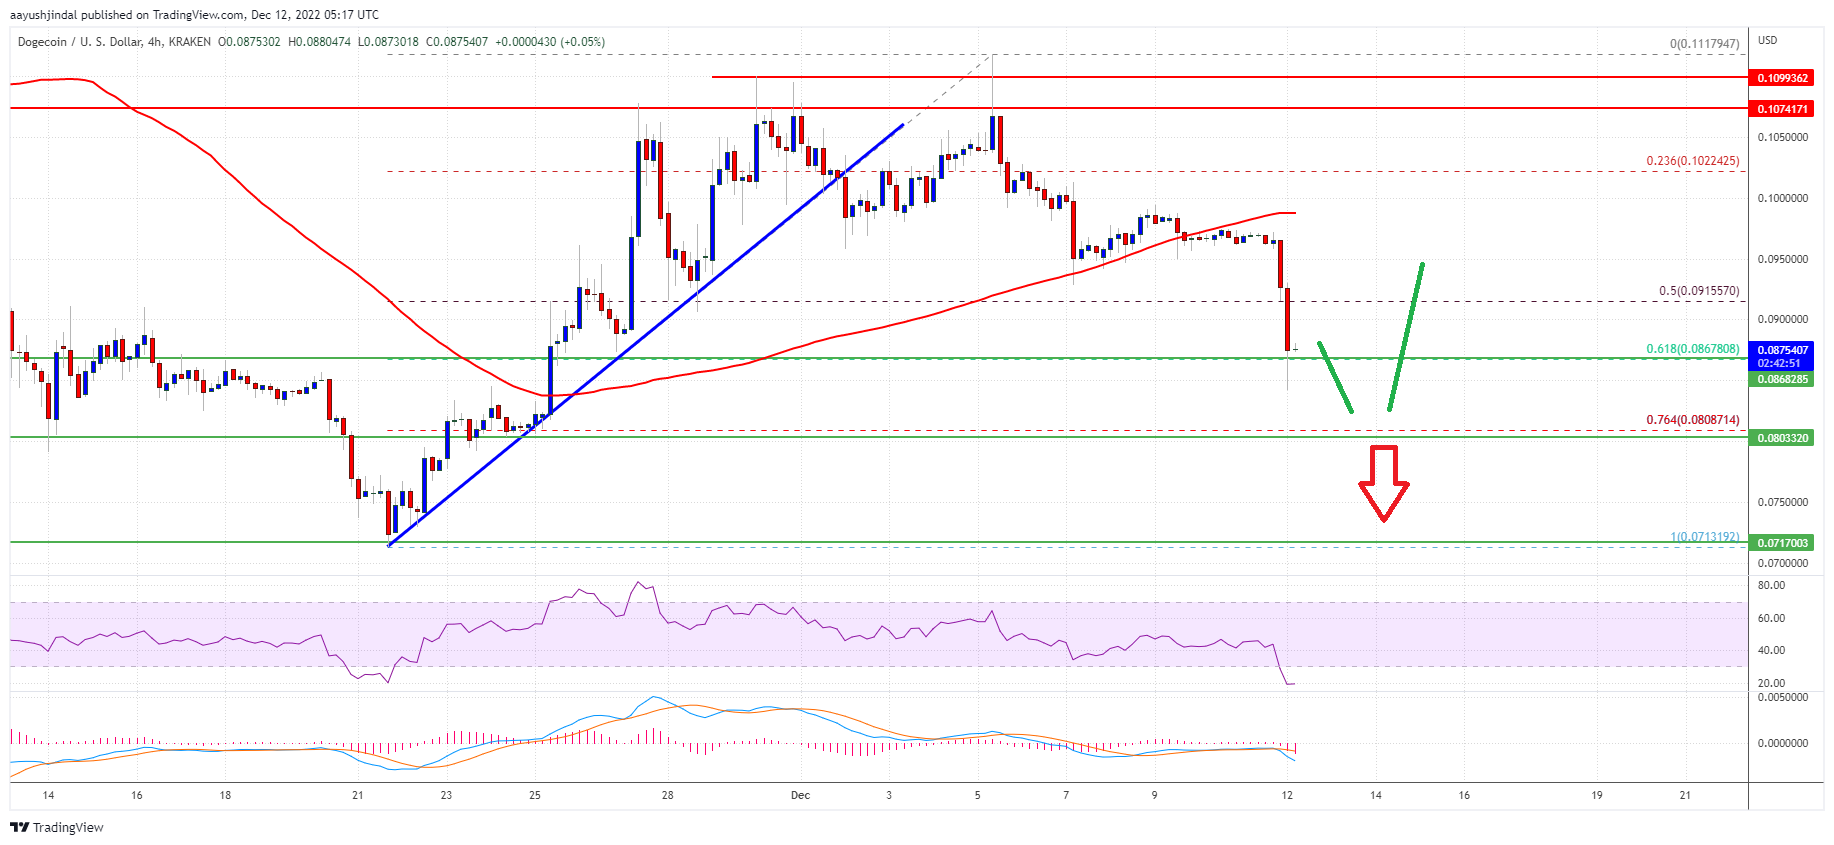
During the decline, there was a break below a key bullish trend line with support near $0.102 on the 4-hours chart of the DOGE/USD pair. The pair even declined below the 50% Fib retracement level of the upward move from the $0.0713 swing low to $0.1117 high.
The price is now trading below the $0.0950 zone and the 100 simple moving average (4-hours). It is also showing a few bearish signs below $0.0900, similar bitcoin and ethereum.
On the upside, the price is facing resistance near the $0.0915 level. The first major resistance is near the $0.1000 level and the 100 simple moving average (4-hours). Any more gains above the $0.1000 zone could start a decent increase towards the $0.1080 zone.
Source: DOGEUSD on TradingView.com
The main hurdle seems to be forming near the $0.1120 zone. A clear move above the $0.1120 resistance could open the gates for a rally towards the $0.120 level.
More Losses in DOGE?
If DOGE price fails to gain pace above the $0.0915 level, it could continue to move down. An initial support on the downside is near the $0.0865 level.
The next major support is near the $0.080 level. It is near the 76.4% Fib retracement level of the upward move from the $0.0713 swing low to $0.1117 high. If there is a downside break below the $0.0800 support, the price could decline further. In the stated case, the price might decline towards the $0.0720 level.
Technical Indicators
4-Hours MACD – The MACD for DOGE/USD is now gaining momentum in the bearish zone.
4-Hours RSI (Relative Strength Index) – The RSI for DOGE/USD is now in the oversold zone.
Major Support Levels – $0.0865, $0.0800 and $0.0720.
Major Resistance Levels – $0.0915, $0.1000 and $0.1120.