

Bitcoin price started a fresh decline from the $24,250 resistance zone against the US Dollar. BTC declined below $23,000 and remains at a risk of more losses.
- Bitcoin started a fresh decline below the $23,500 support zone.
- The price is now trading below the $23,500 level and the 100 hourly simple moving average.
- There was a break below a major bullish trend line with support near $23,320 on the hourly chart of the BTC/USD pair (data feed from Kraken).
- The pair must clear the $23,250 resistance to start a fresh increase in the near term.
Bitcoin Price Breaks Support
Bitcoin price struggled to gain pace above the $24,000 resistance zone. The price formed a top near $24,285 and started a fresh decline.
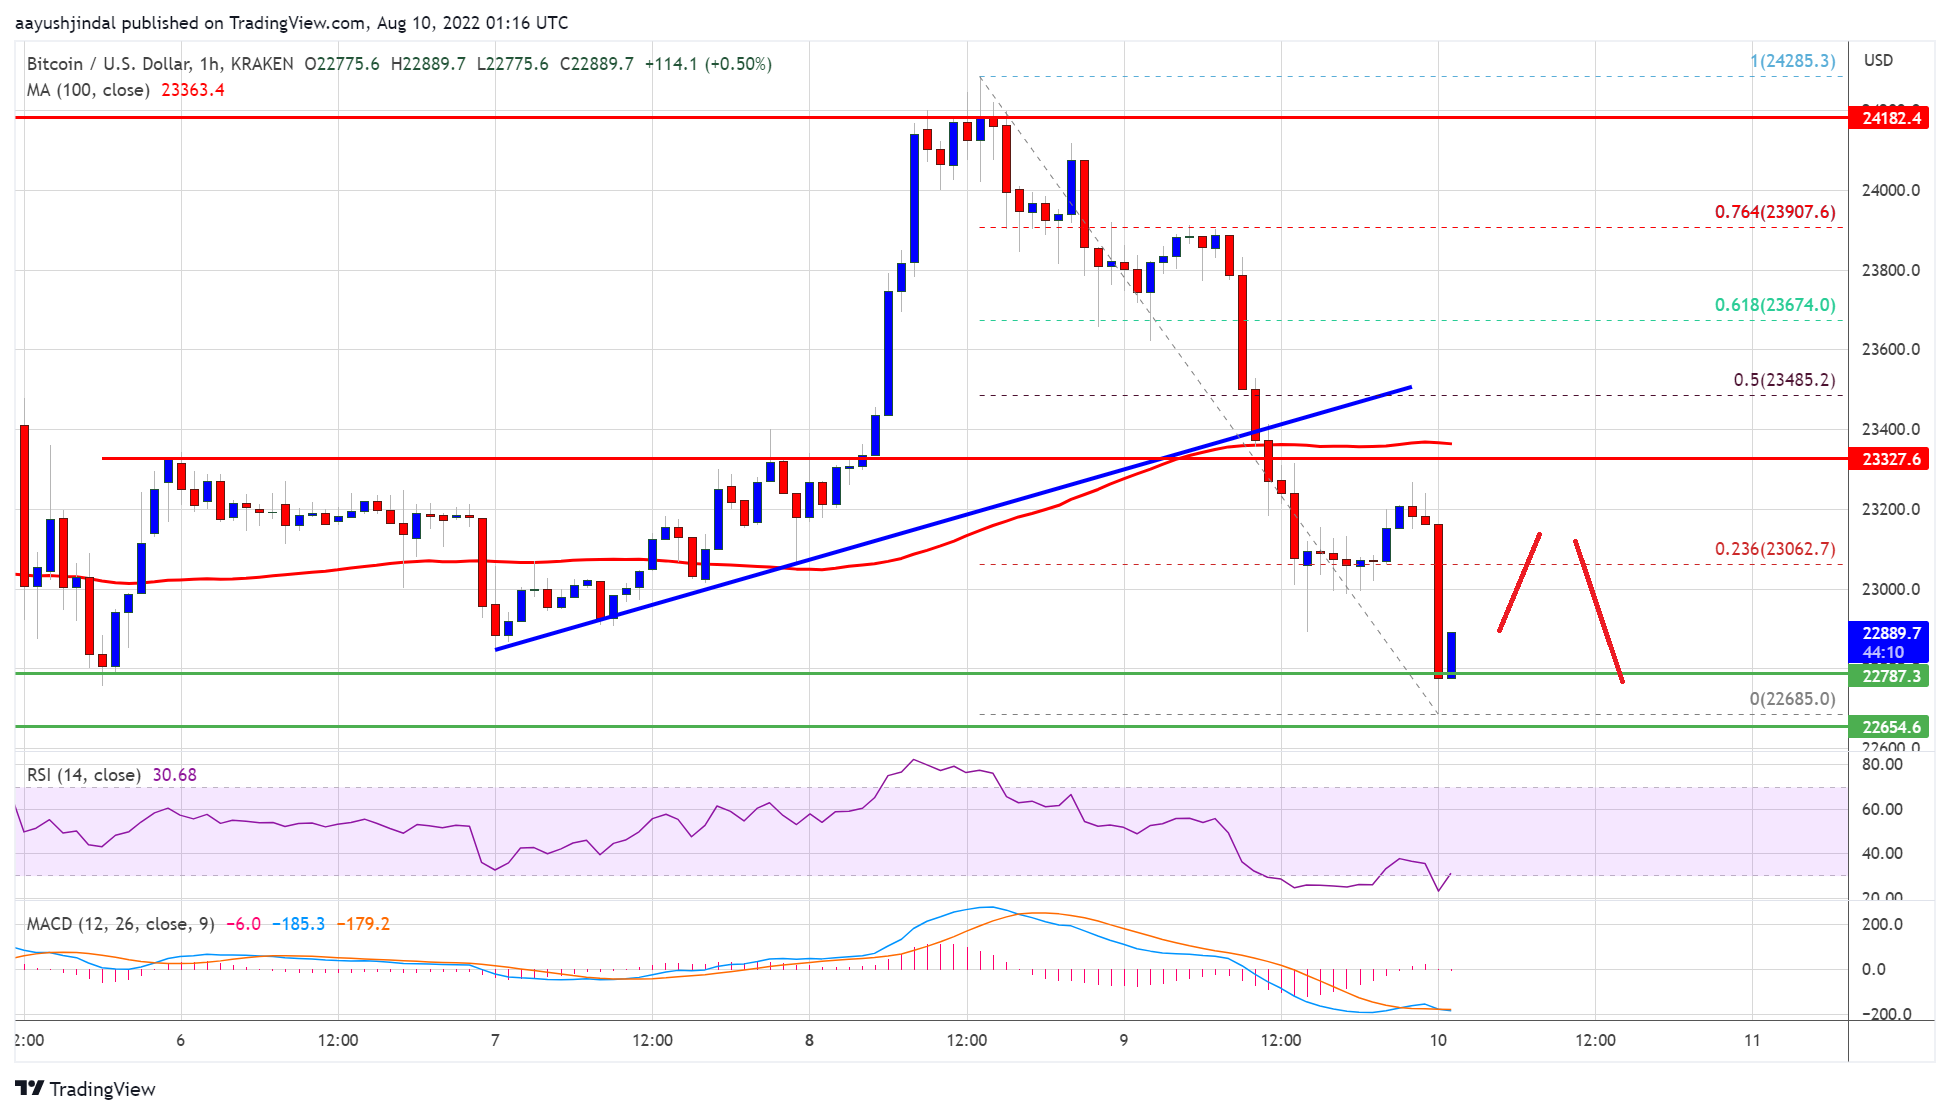
There was a clear move below the $23,800 and $23,500 support levels. The bears pushed the pair below the 61.8% Fib retracement level of the upward move from the $22,846 swing low to $24,286 high. Besides, there was a break below a major bullish trend line with support near $23,320 on the hourly chart of the BTC/USD pair.
Bitcoin price is now trading below the $23,500 level and the 100 hourly simple moving average. It is now consolidating above the key $22,650 support zone.
Source: BTCUSD on TradingView.com
On the upside, an immediate resistance is near the $23,250 level. The next key resistance is near the $23,500 zone. A close above the $23,500 resistance zone could start a steady increase. In the stated case, the price may perhaps rise clear the $24,000 resistance.
Downside Break in BTC?
If bitcoin fails to clear the $23,500 resistance zone, it could continue to mov down. An immediate support on the downside is near the $22,650 level.
The next major support now sits near the $22,500 level. A close below the $22,500 level might start a move towards $22,000. If the bears remain in action, there is a risk of a move towards the $21,500 level in the coming sessions. Any more losses might send the price towards $20,500 level.
Technical indicators:
Hourly MACD – The MACD is now gaining pace in the bearish zone.
Hourly RSI (Relative Strength Index) – The RSI for BTC/USD is now well below the 50 level.
Major Support Levels – $22,650, followed by $22,500.
Major Resistance Levels – $23,250, $23,500 and $24,000.