

Ethereum failed again to settle above the $1,620 zone against the US Dollar. ETH is sliding and might struggle to stay above the $1,480 support.
- Ethereum started another decline after there was a false break above $1,620.
- The price is now trading below $1,560 and the 100 hourly simple moving average.
- There is a key bullish trend line forming with support near $1,500 on the hourly chart of ETH/USD (data feed via Kraken).
- The pair could start a fresh increase unless there is a clear move below the $1,480 support.
Ethereum Price Tests Key Support
Ethereum made another attempt to clear the $1,620 resistance zone. ETH even spiked above the $1,640 and $1,650 levels. However, the bears were active near the $1,660 level.
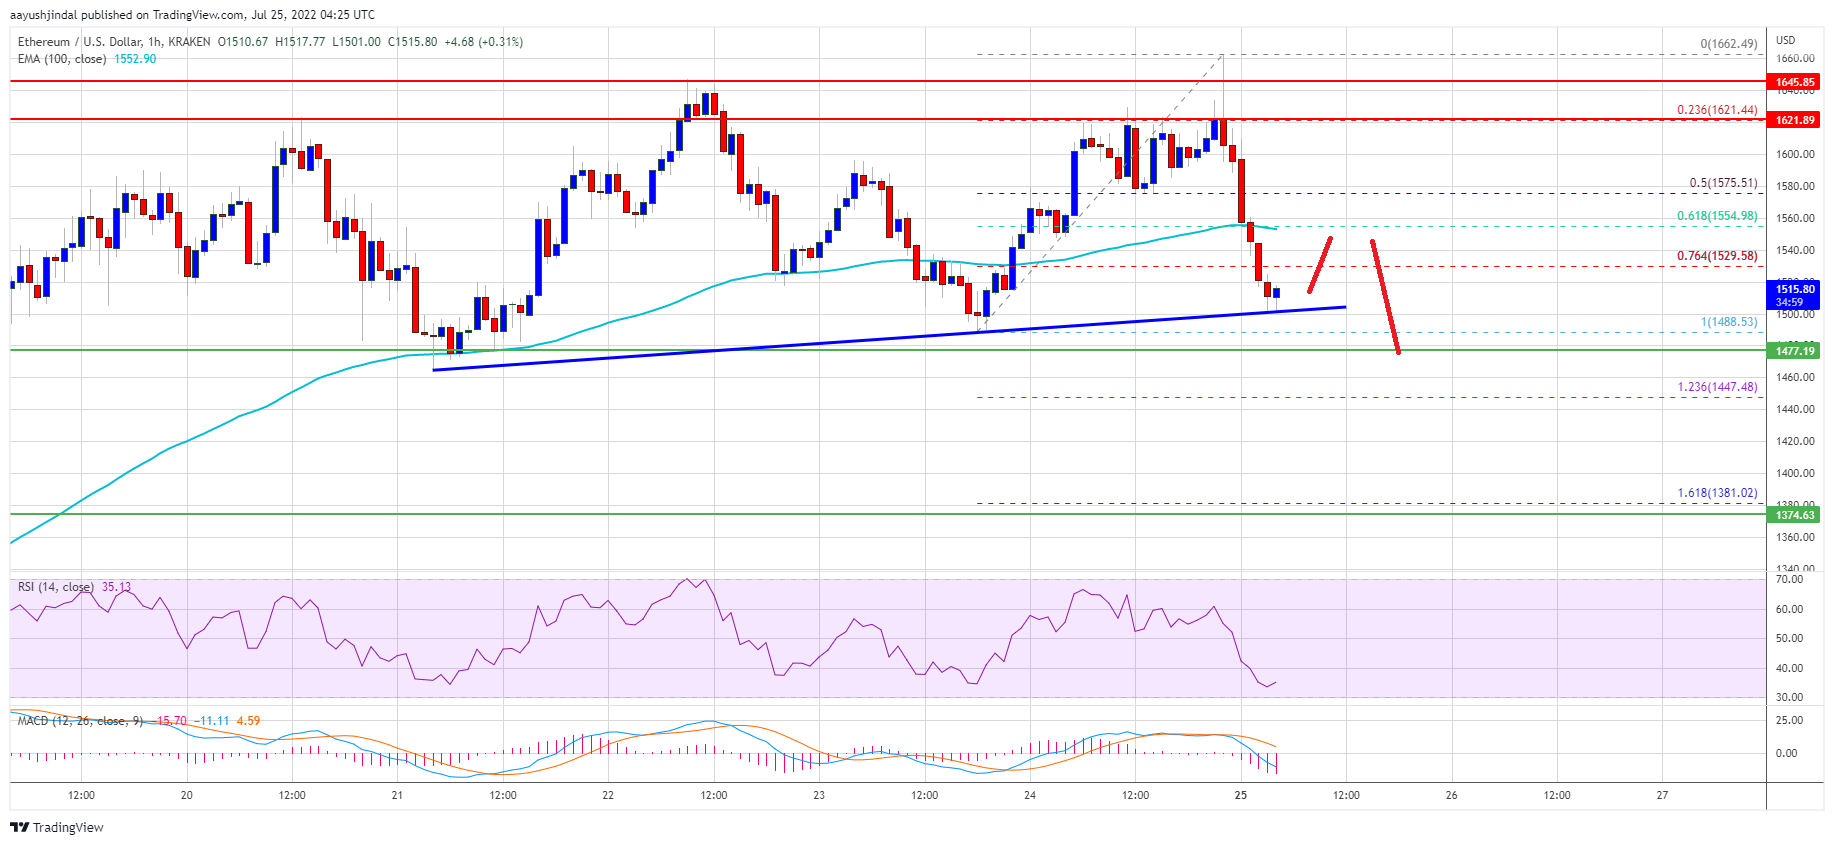
A high was formed near $1,662 and the price started a fresh decline. There was a downside break below the $1,560 and $1,550 levels. Ether price declined below the 50% Fib retracement level of the upward move from the $1,488 swing low to $1,662 high.
The price is now trading below $1,560 and the 100 hourly simple moving average. It is also trading below the 76.4% Fib retracement level of the upward move from the $1,488 swing low to $1,662 high.
However, it is still above the $1,500 support. Besides, there is a key bullish trend line forming with support near $1,500 on the hourly chart of ETH/USD. An immediate resistance on the upside is near the $1,530 level. The first major resistance is near the $1,550 zone and the 100 hourly simple moving average.
Source: ETHUSD on TradingView.com
The main breakout zone is now forming near the $1,620 zone. A clear move above the $1,620 level could start a decent increase. The next key barrier is near the $1,660 level, above which the price might rise towards the $1,700 resistance zone.
More Losses in ETH?
If ethereum fails to rise above the $1,550 resistance, it could continue to move down. An initial support on the downside is near the $1,500 zone and the trend line.
A clear move below the trend line support might push the price towards the $1,480 support zone. Any more losses might even push ether price to the $1,400 support.
Technical Indicators
Hourly MACD – The MACD for ETH/USD is now losing momentum in the bullish zone.
Hourly RSI – The RSI for ETH/USD is now below the 50 level.
Major Support Level – $1,480
Major Resistance Level – $1,550