

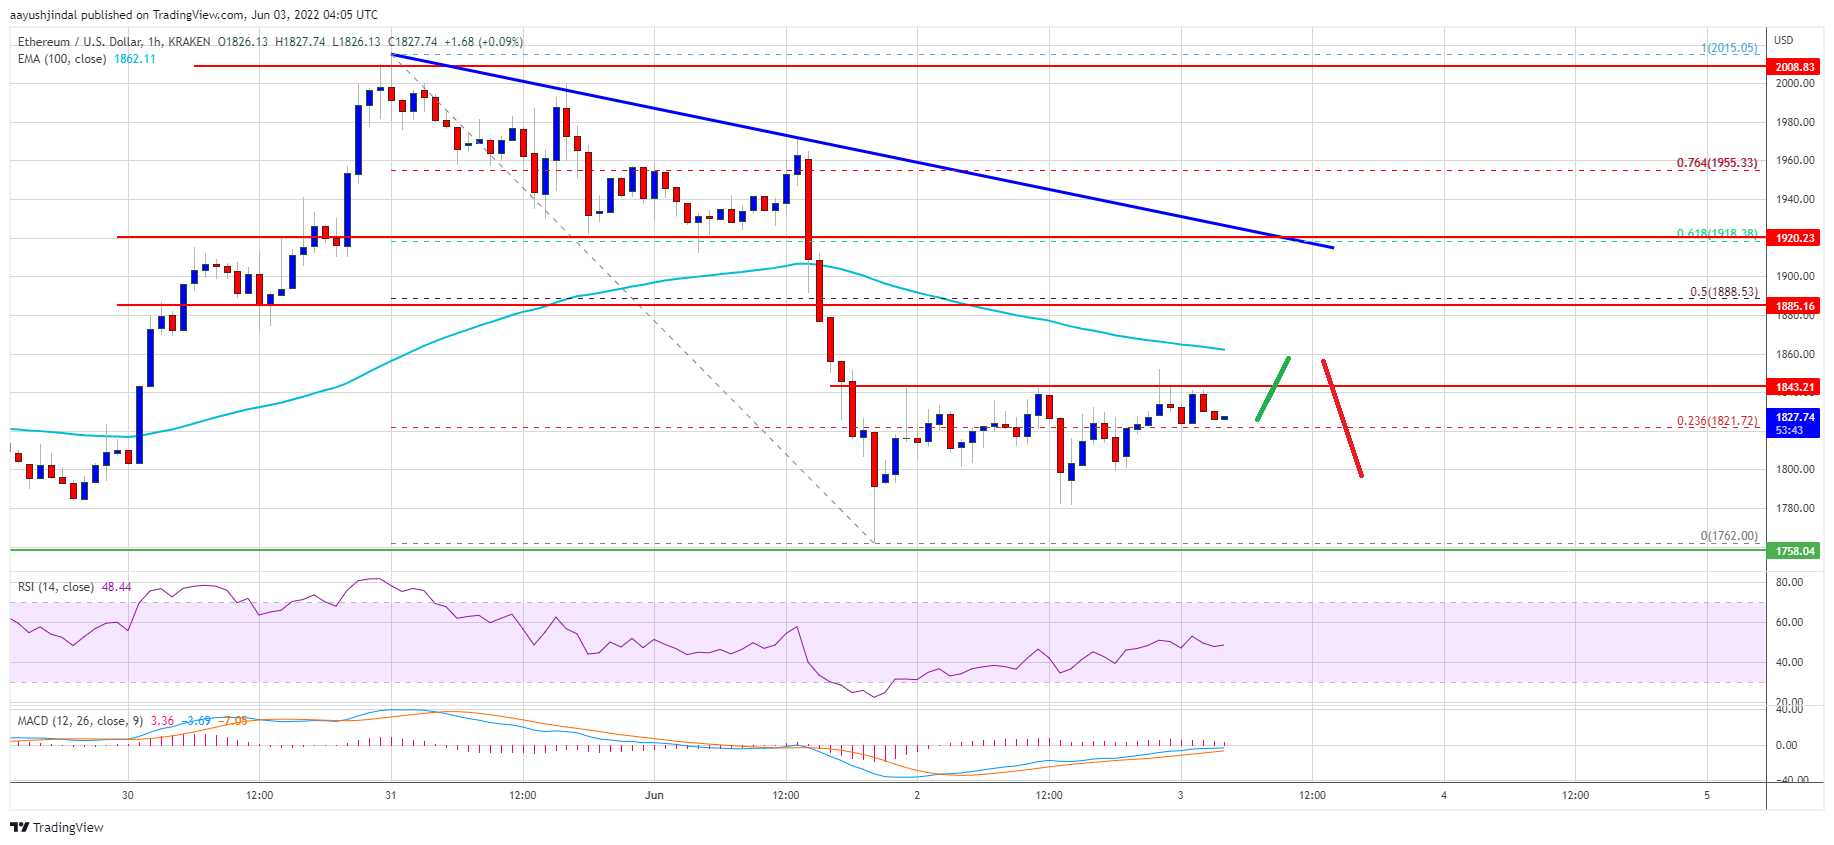
Ethereum found support near $1,760 and corrected higher against the US Dollar. ETH is now facing a major resistance near $1,850 and $1,880.
- Ethereum is slowly moving higher and trading above $1,800.
- The price is now trading below $1,880 and the 100 hourly simple moving average.
- There is a major bearish trend line forming with resistance near $1,905 on the hourly chart of ETH/USD (data feed via Kraken).
- The pair might start a fresh decline unless there is a clear move above $1,880 and $1,920.
Ethereum Price Faces Resistance
Ethereum extended decline below the $1,850 support zone. It even spiked below the $1,800 before the bulls appeared near the $1,760 zone.
A low was formed near $1,762 and the price started a recovery wave. The price climbed above the $1,800 resistance level. Ether price even moved above the 23.6% Fib retracement level of the downward move from the $2,015 swing high to $1,762 low.
However, the bears are currently protecting more gains above the $1,850 level. It is also trading below $1,880 and the 100 hourly simple moving average.
On the upside, an initial resistance is near the $1,860 level and the 100 hourly simple moving average. The next major resistance is near the $1,880 zone. It is near the 50% Fib retracement level of the downward move from the $2,015 swing high to $1,762 low.
Source: ETHUSD on TradingView.com
There is also a major bearish trend line forming with resistance near $1,905 on the hourly chart of ETH/USD. A clear move above the trend line and the $1,920 resistance might start a decent increase. In the stated case, the price could revisit $2,000, above which it could test $2,050.
Fresh Decline in ETH?
If ethereum fails to recover above the $1,920 resistance, it could start another decline. An initial support on the downside is near the $1,800 zone.
The next major support is near the $1,760 level. A clear move below the $1,760 level might spark a major decline. The next major support might be $1,720. Any more losses could send the price towards the $1,650 level in the near term.
Technical Indicators
Hourly MACD – The MACD for ETH/USD is now gaining momentum in the bearish zone.
Hourly RSI – The RSI for ETH/USD is now struggling to clear the 50 level.
Major Support Level – $1,760
Major Resistance Level – $1,920