

Ethereum formed a base near $1,740 and started a recovery wave against the US Dollar. ETH is now facing a major resistance near the $1,900 zone.
- Ethereum started a recovery wave above the $1,800 and $1,820 levels.
- The price is now trading above $1,820 and the 100 hourly simple moving average.
- There was a break above a major bearish trend line with resistance near $1,820 on the hourly chart of ETH/USD (data feed via Kraken).
- The pair must clear the $1,900 and $1,920 resistance levels to continue higher.
Ethereum Price Eyes Upside Break
Ethereum extended decline below the $1,800 level. However, the bulls were active above the $1,700 level. The price consolidated near the $1,740 level before it started a decent upward move.
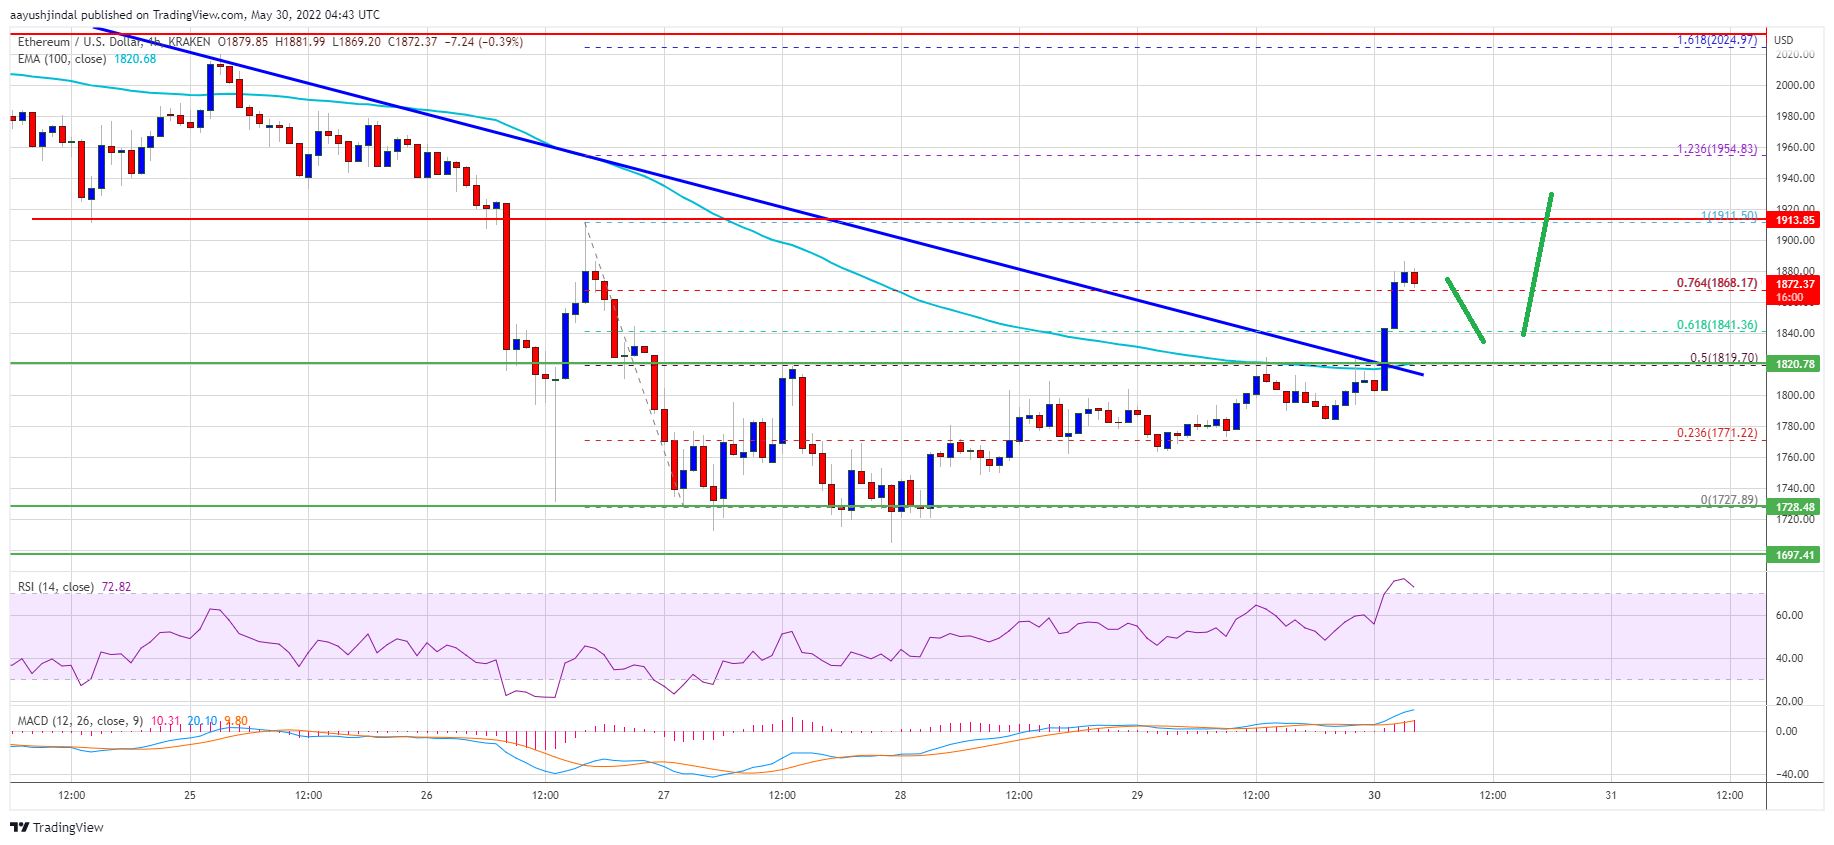
There was a clear move above the $1,800 resistance zone. Ether price surpassed the 50% Fib retracement level of the downward move from the $1,910 swing high to $1,700 base. Besides, there was a break above a major bearish trend line with resistance near $1,820 on the hourly chart of ETH/USD.
The price is now trading well above $1,820 and the 100 hourly simple moving average. It is also consolidating above the 76.4% Fib retracement level of the downward move from the $1,910 swing high to $1,700 base.
Source: ETHUSD on TradingView.com
On the upside, an initial resistance is near the $1,900 level. The next major resistance is near the $1,920 level. A proper upside break above the $1,920 resistance might start a decent increase. In the stated case, ether price could rise towards the $2,000 resistance zone. Any more gains may perhaps send it towards the main $2,085 resistance zone.
Fresh Decline in ETH?
If ethereum fails to continue higher above the $1,920 resistance, it could start a fresh decline. An initial support on the downside is near the $1,840 zone.
The next major support is near the $1,820 level and the 100 hourly simple moving average. A downside break below the $1,820 level might call for another sharp decline. In the stated case, the price could revisit the $1,720 support zone in the near term. The next major support sits near $1,700.
Technical Indicators
Hourly MACD – The MACD for ETH/USD is now gaining momentum in the bullish zone.
Hourly RSI – The RSI for ETH/USD is now well above the 60 level.
Major Support Level – $1,820
Major Resistance Level – $1,920