

Ethereum found support near $2,830 and recovered losses against the US Dollar. ETH price could continue to rise if it stays above the 100 hourly SMA.
- Ethereum started a decent recovery wave above the $2,900 resistance zone.
- The price is now trading above $3,000 and the 100 hourly simple moving average.
- There was a break above a major declining channel with resistance near $2,920 on the hourly chart of ETH/USD (data feed via Kraken).
- The pair could extend increase if there is a clear move above $3,060.
Ethereum Price Eyes Upside Break
Ethereum started a downside correction below the $3,000 support zone and the 100 hourly simple moving average. However, ETH found support near $2,830 and formed a base for a fresh increase.
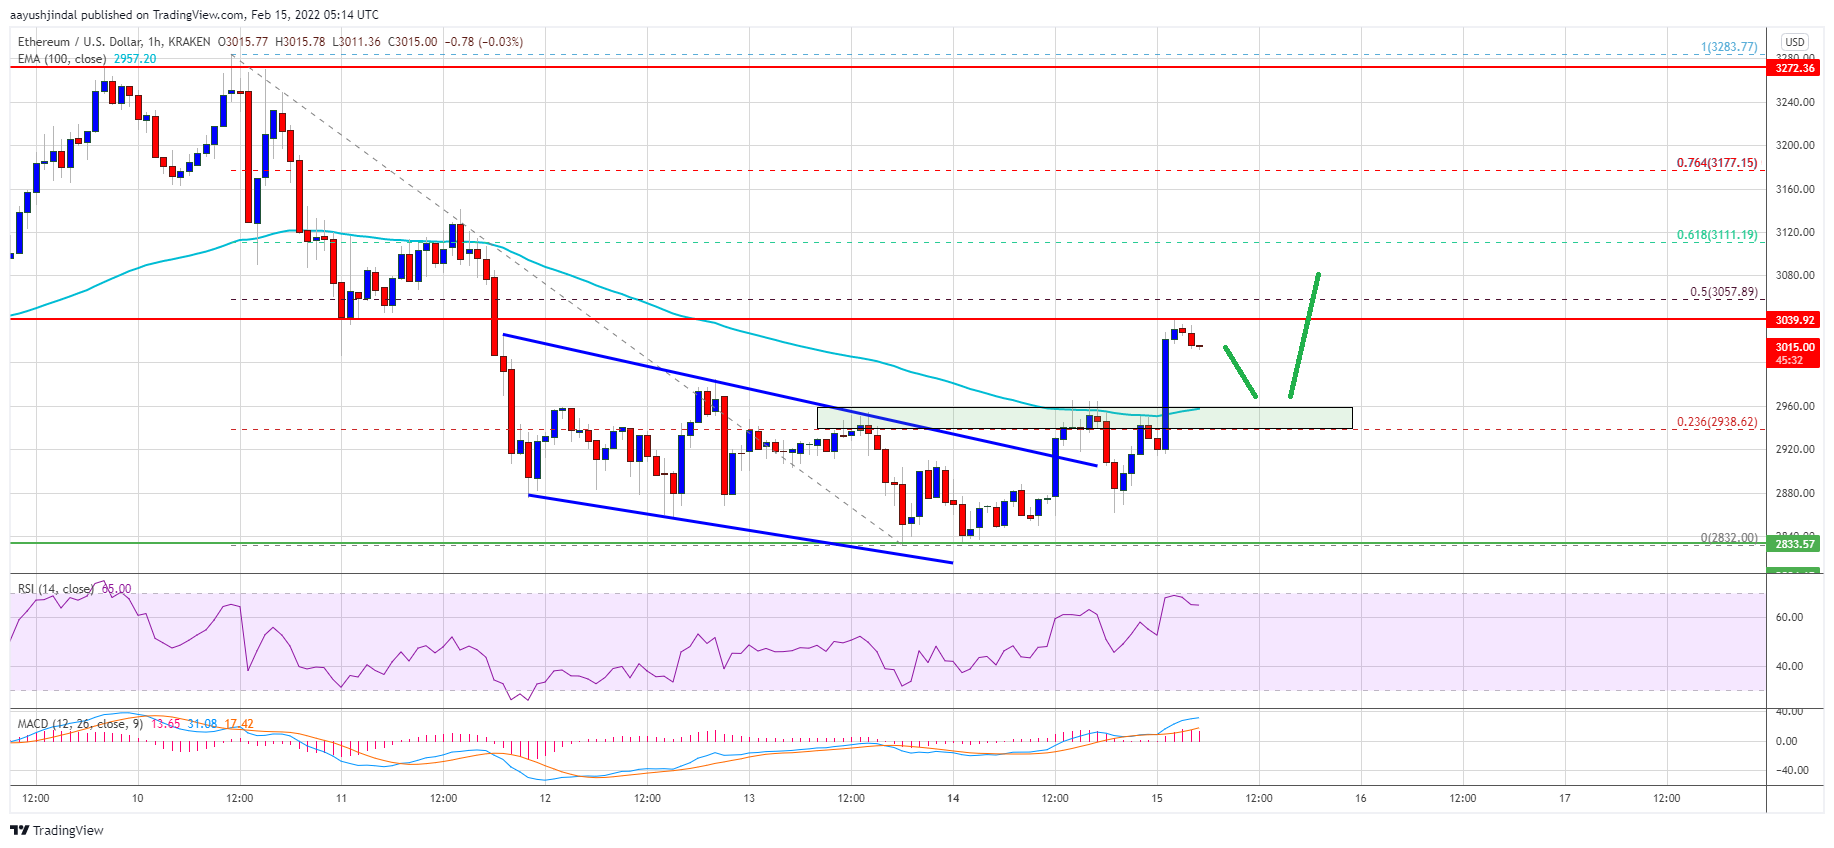
The price climbed above the $2,900 and $2,920 resistance levels. There was a move above the 23.6% Fib retracement level of the key decline from the $3,283 swing high to $2,832 low. Besides, there was a break above a major declining channel with resistance near $2,920 on the hourly chart of ETH/USD.
Ether is now trading above $3,000 and the 100 hourly simple moving average. An immediate resistance is near the $3,040 level. The first major resistance is near the $3,060 level.
Source: ETHUSD on TradingView.com
It coincides with the 50% Fib retracement level of the key decline from the $3,283 swing high to $2,832 low. A successful close above $3,060 might start another increase. In the stated case, the price could surpass the $3,100 and $3,110 levels. Any more gains might send the price towards the $3,250 level. An intermediate resistance is near the $3,200 level.
Fresh Decline in ETH?
If ethereum fails to start a fresh increase above $3,050 or $3,060, it could start a fresh decline. An initial support on the downside is near the $2,980 level.
The next major support is near the $2,960 level and the 100 hourly simple moving average. A downside break below the $2,960 level might push the price towards the $2,920 level. The next major support is near the $2,850 level, below which there is a risk of a larger decline. In the stated case, the price could test $2,680.
Technical Indicators
Hourly MACD – The MACD for ETH/USD is losing pace in the bullish zone.
Hourly RSI – The RSI for ETH/USD is now above the 50 level.
Major Support Level – $2,960
Major Resistance Level – $3,060