

Bitcoin extended increase above the $44,000 resistance zone against the US Dollar. BTC is correcting gains and might decline further if it breaks the $42,800 support.
- Bitcoin extended gains and even climbed above the $45,000 resistance zone.
- The price is trading above $42,500 and the 100 hourly simple moving average.
- There was a break below a key bullish trend line with support near $44,000 on the hourly chart of the BTC/USD pair (data feed from Kraken).
- The pair could extend decline if there is a clear move below the $42,800 support zone.
Bitcoin Price Corrects Lower
Bitcoin price remained in a positive zone above the $42,000 level. BTC gained pace for a move above the $44,000 and $44,500 levels. It even surpassed the $45,000 level and settled above the 100 hourly simple moving average.
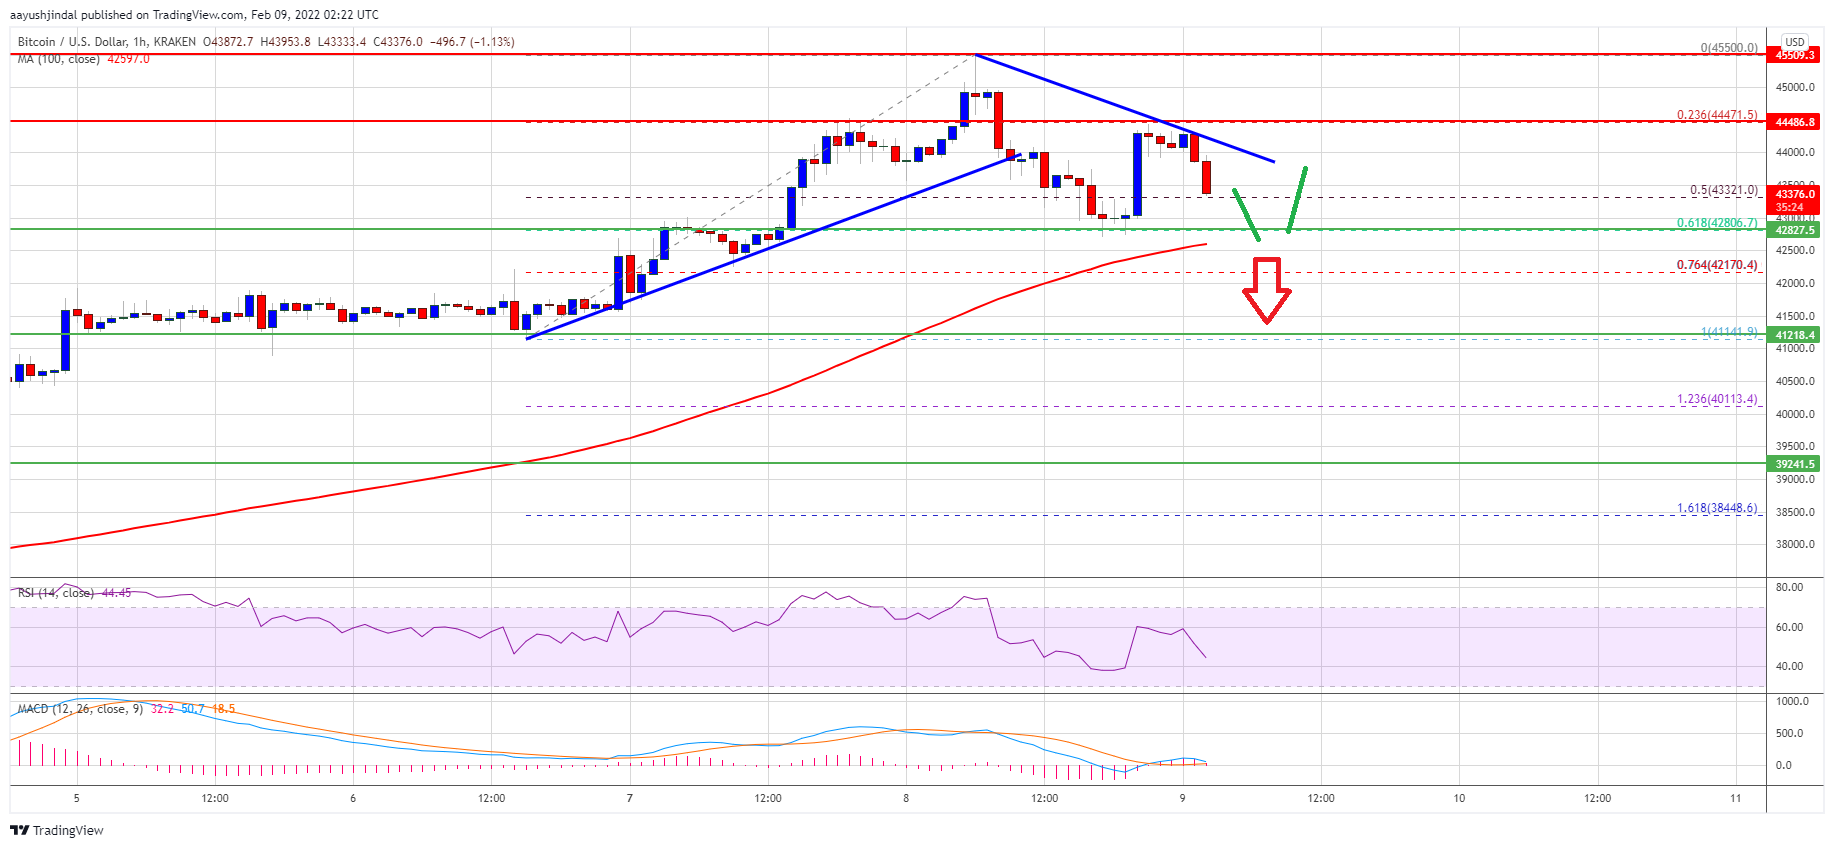
It traded as high as $45,500 and recently started a downside correction. There was a move below the $44,000 support level. Besides, there was a break below a key bullish trend line with support near $44,000 on the hourly chart of the BTC/USD pair.
The pair even declined below the 50% Fib retracement level of the upward move from the $41,140 swing low to $45,500 high. However, the bulls defended the $42,800 support zone.
The 61.8% Fib retracement level of the upward move from the $41,140 swing low to $45,500 high also acted as a strong support. Bitcoin price is now trading above $42,500 and the 100 hourly simple moving average. On the upside, an immediate resistance is near the $44,000 level.
Source: BTCUSD on TradingView.com
There is also a connecting bearish trend line with resistance near $44,000 on the same chart. The next major resistance is near the $44,450 zone, above which the price may perhaps start a fresh increase in the near term.
Downside Break in BTC?
If bitcoin fails to start a fresh increase above $44,000, it could continue to move down. An immediate support on the downside is near the $42,800 zone.
The next major support is seen near the $42,500 level and the 100 hourly simple moving average. If there is a downside break below the $42,500 support, the price could slide towards the $41,200 level.
Technical indicators:
Hourly MACD – The MACD is now gaining momentum in the bearish zone.
Hourly RSI (Relative Strength Index) – The RSI for BTC/USD is now below the 50 level.
Major Support Levels – $42,800, followed by $42,500.
Major Resistance Levels – $44,000, $44,450 and $45,500.