

Bitcoin stayed above the $36,000 support zone against the US Dollar. BTC is now rising, but it could face hurdles near $37,800 and $38,000.
- Bitcoin started a decent recovery wave from the $36,400 zone.
- The price is still trading below $38,000 and the 100 hourly simple moving average.
- There is a key bearish trend line forming with resistance near $37,800 on the hourly chart of the BTC/USD pair (data feed from Kraken).
- The pair must clear $37,800 and $38,000 to start a steady increase in the near term.
Bitcoin Price Corrects Losses
Bitcoin price started a steady decline from well above the $38,000 level. BTC traded below the $37,000 level and settled below the 100 hourly simple moving average.
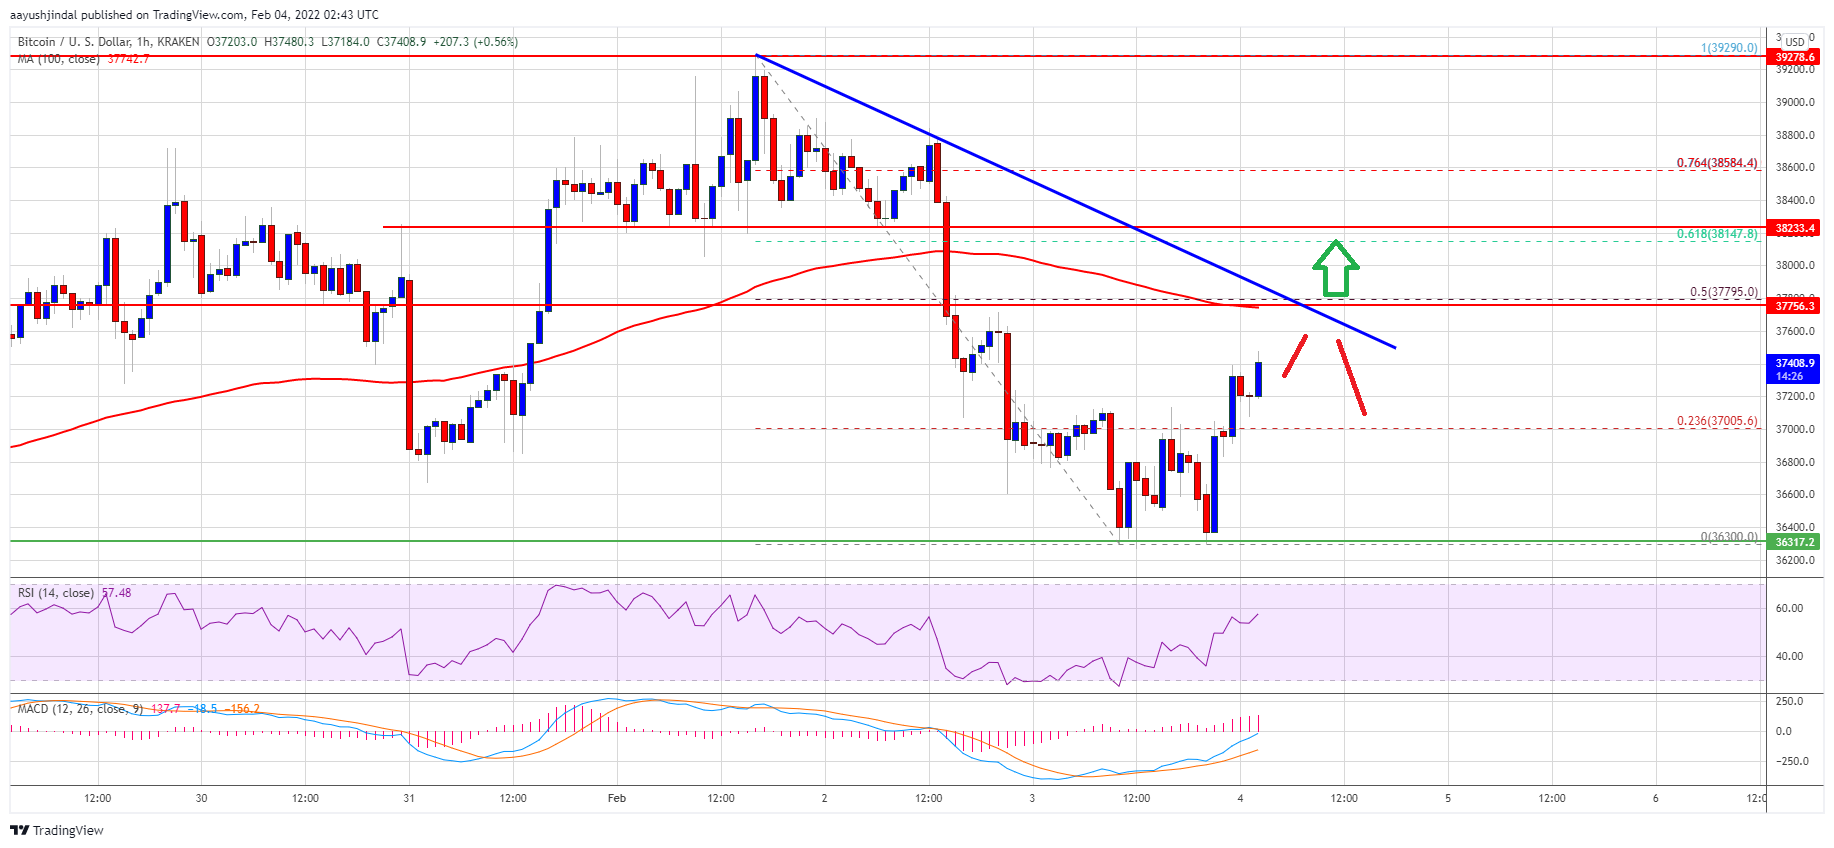
However, the bulls were active above the $36,000 and $36,200 levels. A low was formed near $36,300 and the price is now correcting losses. There was a clear move above the $37,000 resistance. The price climbed above the 23.6% Fib retracement level of the downward move from the $39,290 swing high to $36,300 low.
Bitcoin is now consolidating near the $37,500 level. It is still trading below $38,000 and the 100 hourly simple moving average. On the upside, an initial resistance is near the $37,600 level.
The first major resistance is near the $37,800 zone. There is also a key bearish trend line forming with resistance near $37,800 on the hourly chart of the BTC/USD. The trend line is near the 50% Fib retracement level of the downward move from the $39,290 swing high to $36,300 low.
Source: BTCUSD on TradingView.com
The 100 hourly simple moving average could also act as a hurdle near $37,800. A clear move above the trend line resistance and $38,000 could set the pace for a steady increase.
Fresh Decline in BTC?
If bitcoin fails to start a fresh increase above $38,000, it could start another decline. An immediate support on the downside is near the $37,000 zone.
The first major support is seen near the $36,300 zone. Any more losses might call for a move towards the $36,000 support zone. If the bulls fail to protect $36,000, there could be a sharp decline in the near term.
Technical indicators:
Hourly MACD – The MACD is now gaining momentum in the bullish zone.
Hourly RSI (Relative Strength Index) – The RSI for BTC/USD is now above the 50 level.
Major Support Levels – $36,300, followed by $36,000.
Major Resistance Levels – $37,800, $38,000 and $39,250.