

Bitcoin failed to test the $50,000 resistance against the US Dollar. BTC is correcting gains, but dips could be limited below the $47,500 support.
- Bitcoin struggled to surpass the $49,500 resistance zone and corrected lower.
- The price is trading above $48,000 and the 100 hourly simple moving average.
- There was a break below a key rising channel with support near $49,000 on the hourly chart of the BTC/USD pair (data feed from Kraken).
- The pair could start a fresh increase if it stays above the $47,500 support zone.
Bitcoin Price Remains Supported
Bitcoin price formed a base and started a fresh increase above the $47,500 level. BTC gained pace for a move above the $48,500 level and the 100 hourly simple moving average.
The upward move was such that the price even spiked above the $49,200 resistance. However, the bulls failed to pump the price towards the $50,000 level. A high was formed near $49,599 and the price started a downside correction.
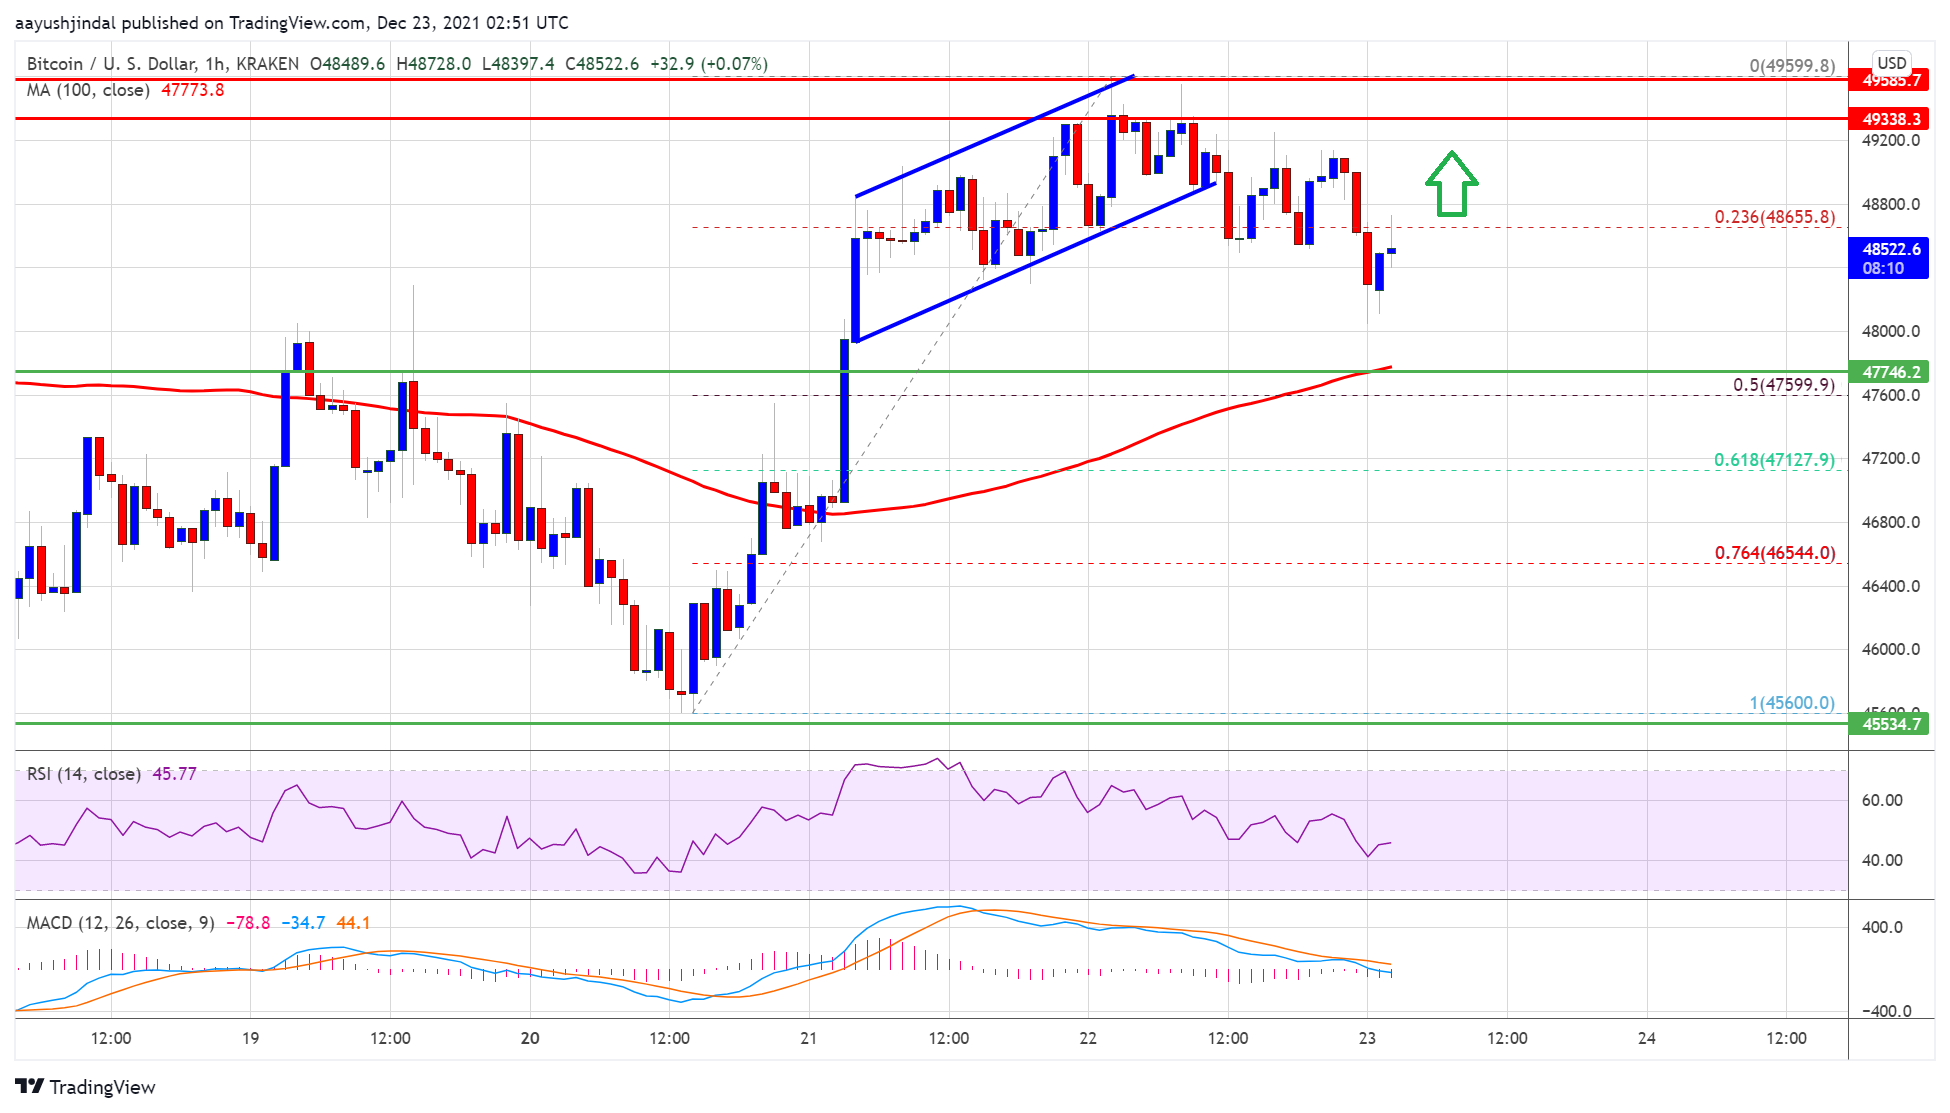
There was a break below the $49,000 level. Besides, there was a break below a key rising channel with support near $49,000 on the hourly chart of the BTC/USD pair.
The pair traded below the 23.6% Fib retracement level of the upward move from the $45,600 swing low to $45,599 high. Bitcoin tested the $48,000 zone and is currently rising. It is facing resistance near the $48,800 zone.
Source: BTCUSD on TradingView.com
The next key resistance could be $49,200. The main breakout zone is now near $49,500. A clear move above the $49,500 resistance zone could lift the market sentiment for a move above $50,000. The next major stop for the bulls may possibly be near the $51,200 level.
Dips Limited In BTC?
If bitcoin fails to clear the $49,500 resistance zone, it could extend its decline. An immediate support on the downside is near the $48,000 level.
The first major support is near $47,500. It is near the 50% Fib retracement level of the upward move from the $45,600 swing low to $45,599 high. A downside break below the $47,500 level could push the price towards the $46,500 support, below which the price could test $45,500.
Technical indicators:
Hourly MACD – The MACD is slowly losing pace in the bearish zone.
Hourly RSI (Relative Strength Index) – The RSI for BTC/USD is below the 50 level.
Major Support Levels – $48,000, followed by $47,500.
Major Resistance Levels – $49,000, $49,500 and $50,000.