

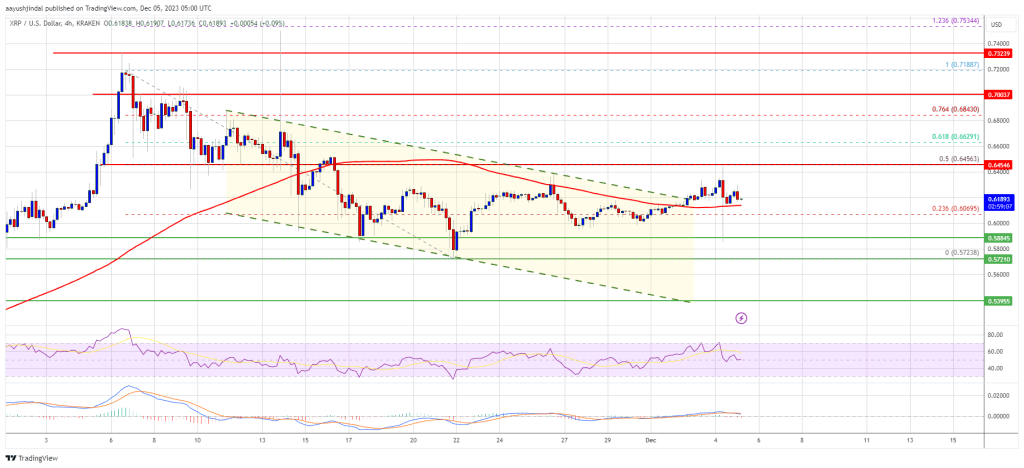
XRP price is eyeing a key upside break above the $0.650 resistance. The price could rally toward $0.70 if it clears the $0.650 resistance.
- XRP is slowly moving higher above the $0.612 level.
- The price is now trading above $0.615 and the 100 simple moving average (4 hours).
- There was a break above a major declining channel with resistance near $0.618 on the 4-hour chart of the XRP/USD pair (data source from Kraken).
- The pair start a fresh rally if it clears the $0.645 and $0.650 resistance levels.
XRP Price Aims Higher
In the past few days, XRP formed a base above the $0.5880 pivot level. The price started a decent increase above the $0.600 resistance but failed to rally like Bitcoin and Ethereum.
There was a move above the 23.6% Fib retracement level of the main decline from the $0.720 swing high to the $0.5720 swing low. Besides, there was a break above a major declining channel with resistance near $0.618 on the 4-hour chart of the XRP/USD pair.
The price is now trading above $0.615 and the 100 simple moving average (4 hours). On the upside, immediate resistance is near the $0.625 level. The first major resistance is near the $0.645 zone or the 50% Fib retracement level of the main decline from the $0.720 swing high to the $0.5720 swing low.
Source: XRPUSD on TradingView.com
The main resistance sits at $0.650. A close above the $0.650 resistance zone could spark a steady increase. The next key resistance is near $0.685. If the bulls remain in action above the $0.658 resistance level, there could be a rally toward the $0.700 resistance. Any more gains might send XRP toward the $0.720 resistance.
Another Decline?
If XRP fails to clear the $0.650 resistance zone, it could start a fresh decline. Initial support on the downside is near the $0.615 zone and the 100 simple moving average (4 hours).
The next major support is at $0.600. If there is a downside break and a close below the $0.600 level, XRP price might accelerate lower. In the stated case, the price could retest the $0.572 support zone.
Technical Indicators
4-Hours MACD – The MACD for XRP/USD is now gaining pace in the bearish zone.
4-Hours RSI (Relative Strength Index) – The RSI for XRP/USD is now near the 50 level.
Major Support Levels – $0.600, $0.588, and $0.572.
Major Resistance Levels – $0.645, $0.650, and $0.700.