

Ethereum price is struggling below the $1,840 resistance against the US Dollar. ETH could decline heavily if there is a clear move below the $1,780 support.
- Ethereum is currently facing many hurdles near the $1,840 resistance zone.
- The price is trading below $1,820 and the 100-hourly Simple Moving Average.
- There is a major bearish trend line forming with resistance near $1,825 on the hourly chart of ETH/USD (data feed via Kraken).
- The pair could start a fresh increase if it clears the $1,825 and $1,840 resistance levels.
Ethereum Price Faces Uphill Task
Ethereum’s price remained in a bearish zone below the $1,840 zone. ETH started a fresh decline below the $1,800 level and showed a few bearish signs, similar to Bitcoin.
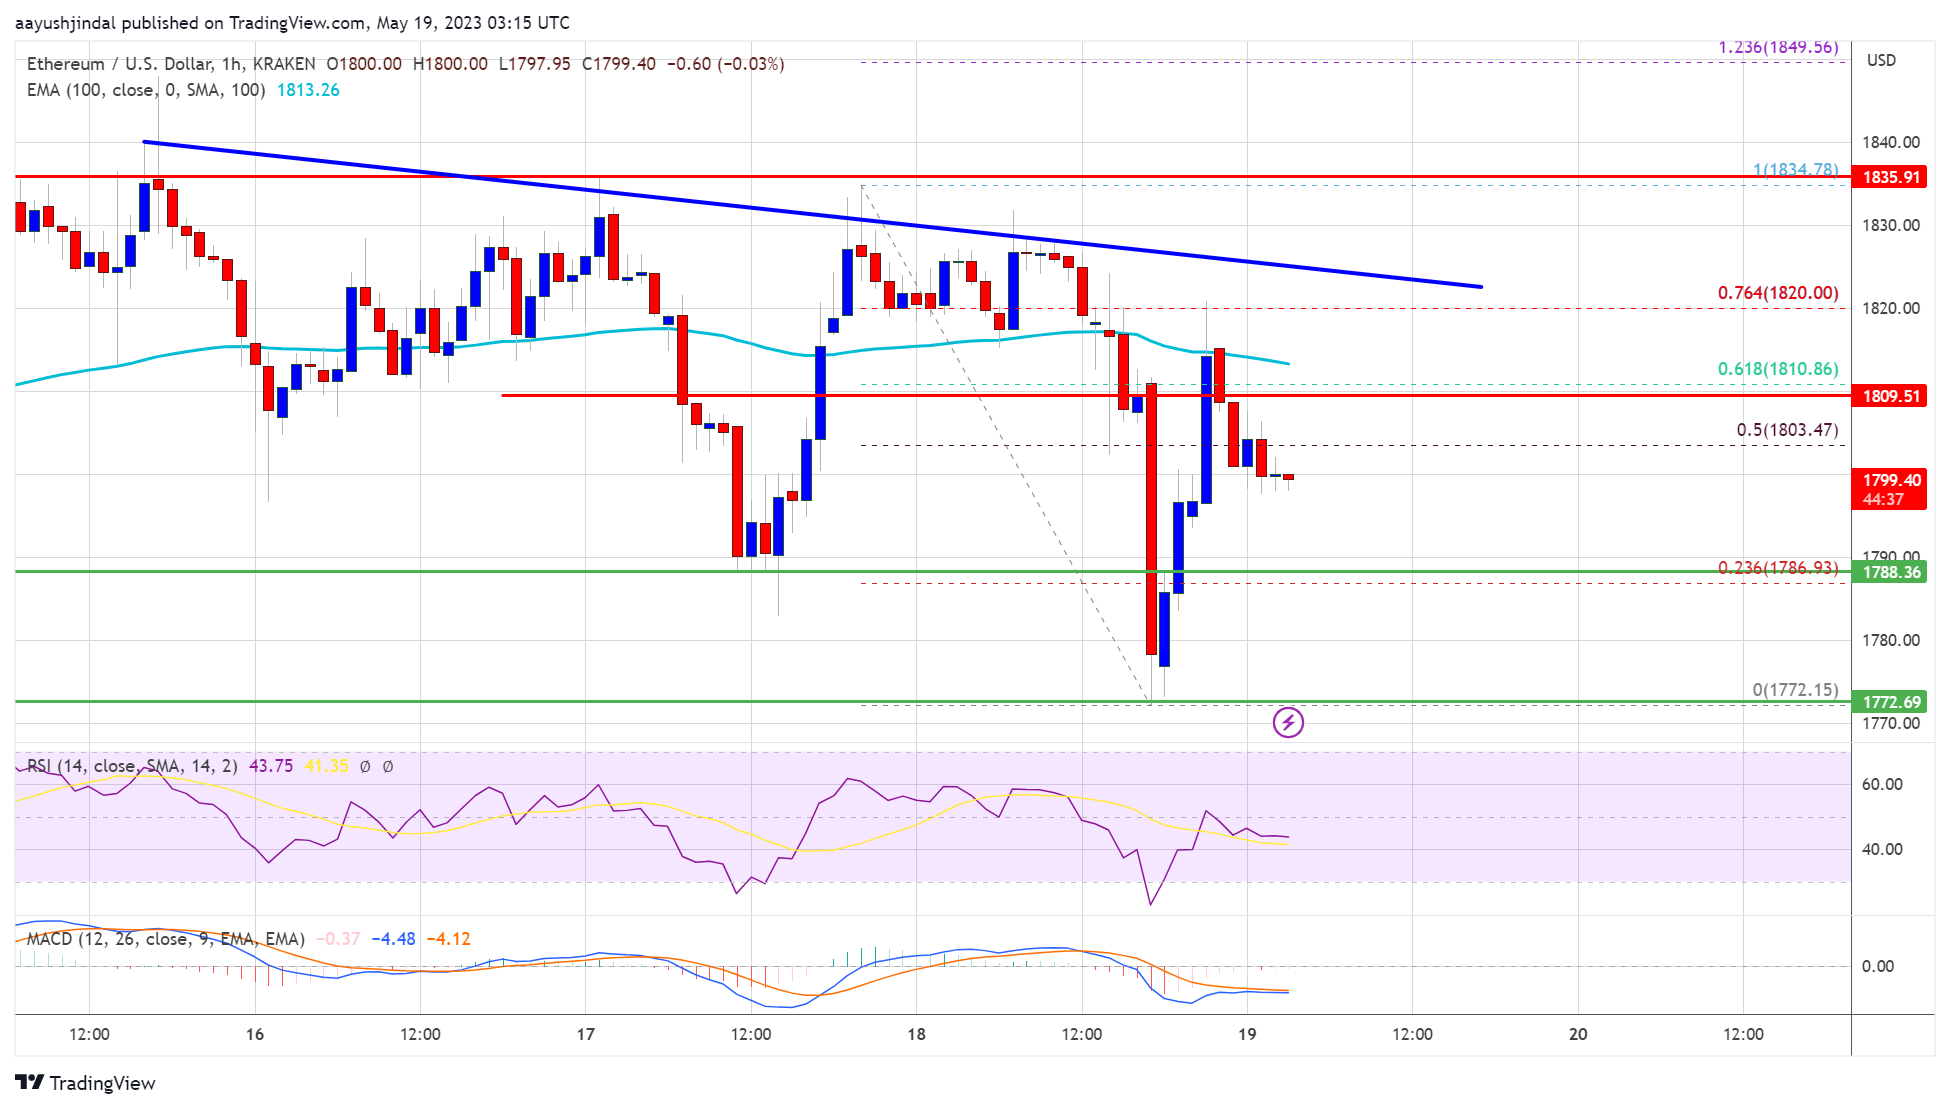
The price even declined below the $1,780 level. A low is formed near $1,772 and the price is now correcting losses. There was a move above the $1,800 level. The price cleared the 50% Fib retracement level of the downward move from the $1,834 swing high to the $1,772 low.
Ether is now trading above $1,820 and the 100-hourly Simple Moving Average. There is also a major bearish trend line forming with resistance near $1,825 on the hourly chart of ETH/USD.
Immediate resistance is near the $1,820 level. It is close to the 61.8% Fib retracement level of the downward move from the $1,834 swing high to the $1,772 low. The next resistance sits near $1,825 and the trend line, above which Ethereum could rise toward $1,820.
Source: ETHUSD on TradingView.com
If there is a move above the $1,840 resistance level, the price might start a decent increase toward the $1,920 level. Any more gains above the $1,920 resistance zone could start a decent increase toward the $2,000 resistance.
Fresh Decline in ETH?
If Ethereum fails to clear the $1,825 resistance, it could start another decline. Initial support on the downside is near the $1,785 level.
The next major support is near the $1,770 zone. If there is a clear move below the $1,770 support, the price could decline sharply. In the stated case, the price might drop toward the $1,720 support zone. Any more losses may perhaps take the price toward the $1,700 level in the near term.
Technical Indicators
Hourly MACD – The MACD for ETH/USD is gaining momentum in the bearish zone.
Hourly RSI – The RSI for ETH/USD is below the 50 level.
Major Support Level – $1,770
Major Resistance Level – $1,825