

Bitcoin price is struggling to clear the $28,200 resistance. BTC is again moving lower and might decline toward the $27,000 support zone.
- Bitcoin attempted an upside break above $28,200 but failed.
- The price is trading below $28,000 and the 100 hourly Simple moving average.
- There is a connecting bearish trend line forming with resistance near $28,000 on the hourly chart of the BTC/USD pair (data feed from Kraken).
- The pair could continue to move down if stays below $28,000 and $28,200.
Bitcoin Price Faces Rejection
Bitcoin price started a recovery wave above the $27,800 level. BTC cleared the $28,000 resistance zone and spiked above the 100 hourly Simple moving average.
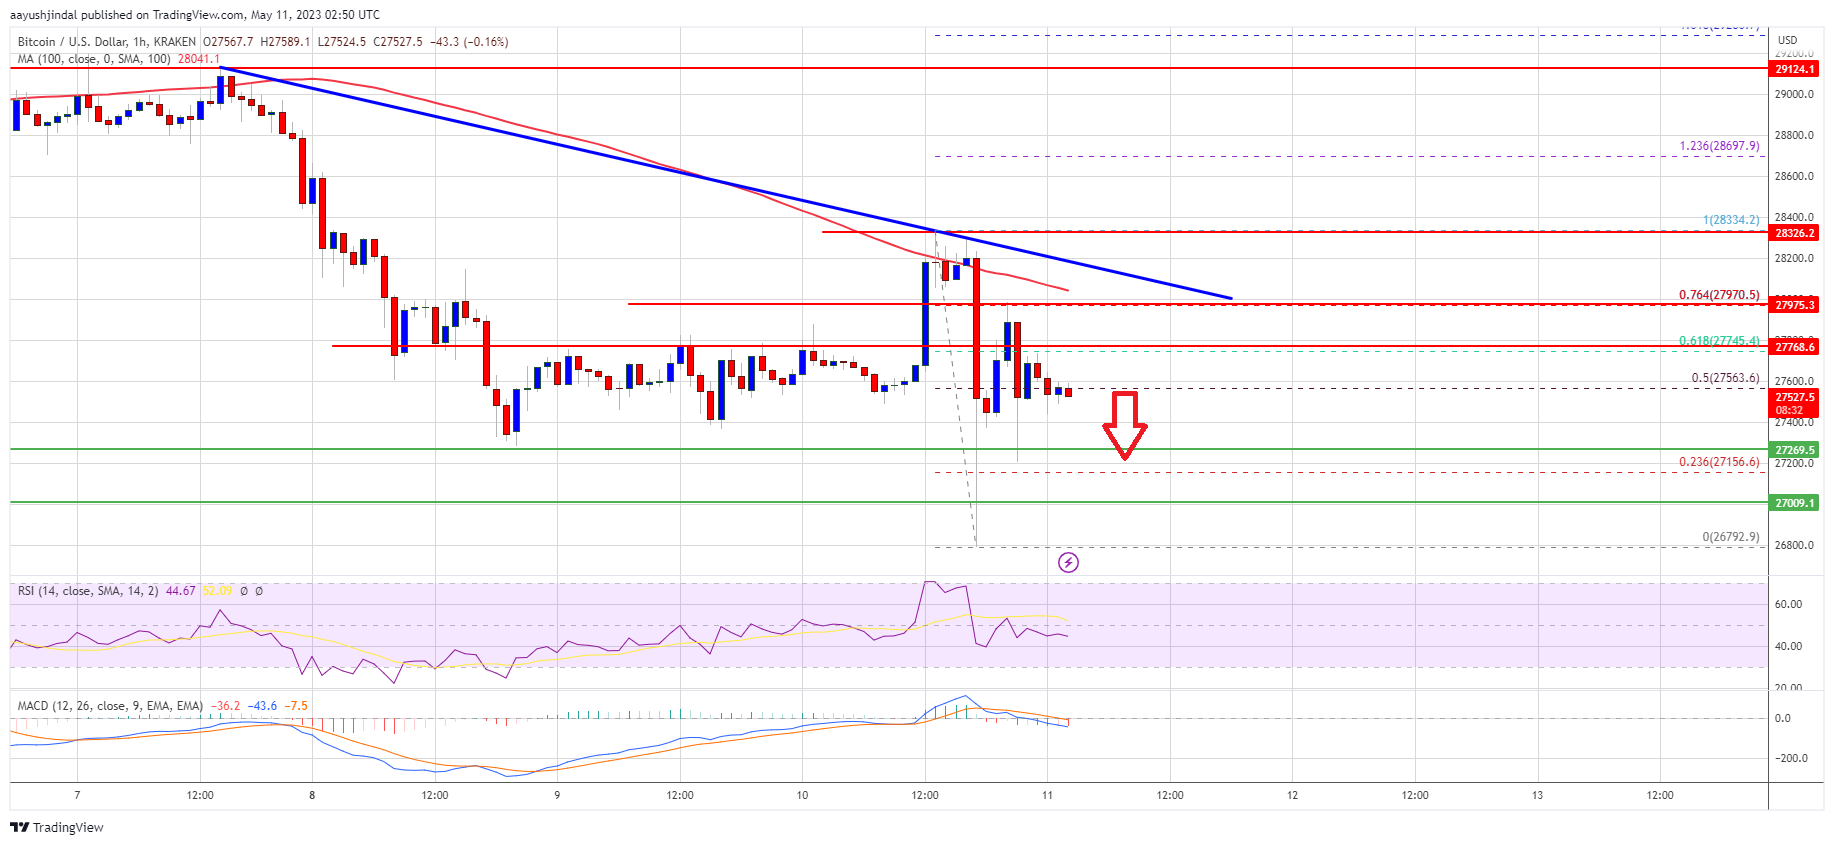
However, the bears were active above the $28,200 resistance. A high was formed near $28,334 and the price tumbled to $27,000. A low is formed near $26,792 and the price is now consolidating. It is trading near the 50% Fib retracement level recent decline from the $28,334 swing high to the $26,792 low.
Bitcoin is trading below $28,000 and the 100 hourly Simple moving average. There is also a connecting bearish trend line forming with resistance near $28,000 on the hourly chart of the BTC/USD pair.
Immediate resistance is near the $27,750 level. The next major resistance is near the $28,000 level or the trend line. It is close to the 76.4% Fib retracement level recent decline from the $28,334 swing high to the $26,792 low. The main resistance is now forming near the $28,200 level and the 100 hourly Simple moving average.
Source: BTCUSD on TradingView.com
A close above the $28,200 resistance might start a decent increase. The next key resistance is near $28,500, above which the price might climb toward the $29,200 resistance. Any more gains could open the doors for a decent move toward the $29,500 resistance.
Fresh Decline in BTC?
If Bitcoin’s price fails to clear the $28,000 resistance, it could continue to move down. Immediate support on the downside is near the $27,200 level.
The next major support is near the $27,000 zone, below which the price might move further into a bearish zone. In the stated case, it could revisit the $26,500 level. Any more losses might take Bitcoin toward the $26,200 level in the near term.
Technical indicators:
Hourly MACD – The MACD is now losing pace in the bearish zone.
Hourly RSI (Relative Strength Index) – The RSI for BTC/USD is now below the 50 level.
Major Support Levels – $27,200, followed by $27,000.
Major Resistance Levels – $28,000, $28,200, and $28,500.