

Bitcoin price is rising steadily above $29,000. BTC could start a strong upward move if there is a close above the $30,000 resistance.
- Bitcoin is showing positive signs and rising toward the $30,000 resistance zone.
- The price is trading above $28,800 and the 100 hourly Simple moving average.
- There is a key rising channel forming with resistance near $29,600 on the hourly chart of the BTC/USD pair (data feed from Kraken).
- The pair could start a major increase if there is a close above the $30,000 resistance zone.
Bitcoin Price Regains Strength
Bitcoin price formed a base above the $28,000 support zone. BTC started a steady increase and there were bullish moves seen after the Fed hiked interest rates to 5.25%.
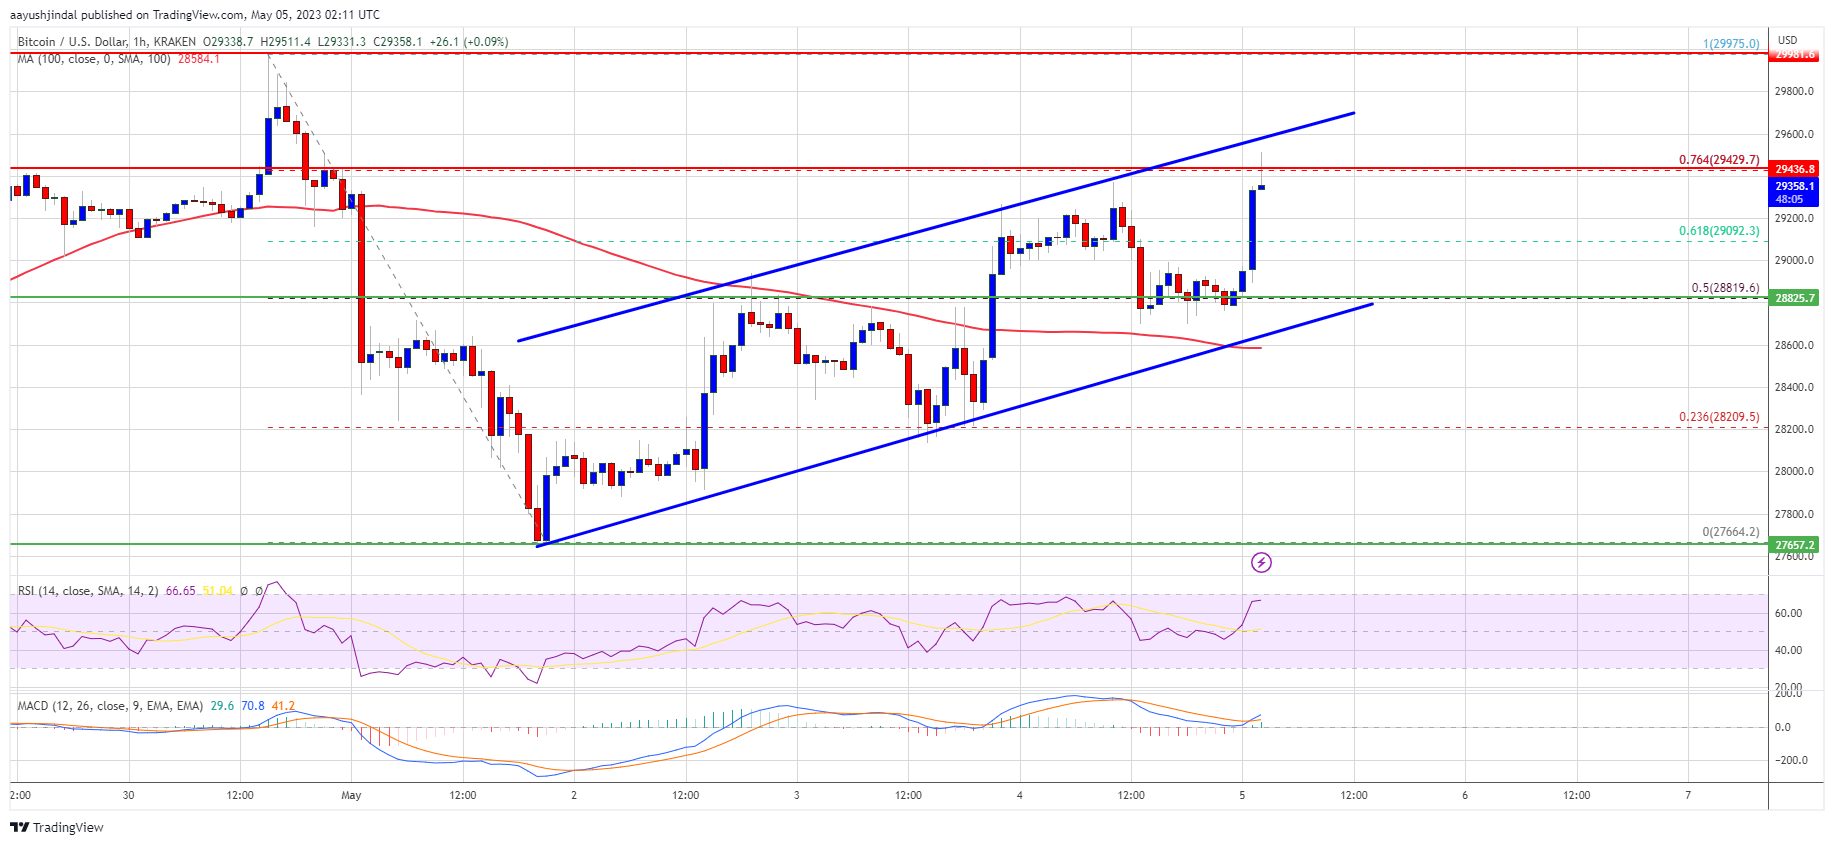
The bulls were able to push the price above the $28,800 resistance zone. There was a break above the 61.8% Fib retracement level of the downward move from the $29,975 swing high to the $27,665 low. It opened the doors for a move above $29,000.
Bitcoin is now trading above $28,800 and the 100 hourly Simple moving average. There is also a key rising channel forming with resistance near $29,600 on the hourly chart of the BTC/USD pair.
Immediate resistance is near the $29,420 level. It is close to the 76.4% Fib retracement level of the downward move from the $29,975 swing high to the $27,665 low. The next major resistance is near the channel, above which the price might rise toward the $30,000 resistance zone.
Source: BTCUSD on TradingView.com
Any more gains could open the doors for a decent rally toward the $31,200 resistance. In the stated case, the price may perhaps rise toward the $32,500 level.
Fresh Decline in BTC?
If Bitcoin’s price fails to clear the $29,600 resistance, it could start a downside correction. Immediate support on the downside is near the $28,800 level and the channel trend line.
The next major support is near the $28,600 zone or the 100 hourly Simple moving average, below which the price might drop toward the $28,200 support zone. Any more losses might take Bitcoin toward the $27,650 level in the near term.
Technical indicators:
Hourly MACD – The MACD is now gaining pace in the bullish zone.
Hourly RSI (Relative Strength Index) – The RSI for BTC/USD is now above the 50 level.
Major Support Levels – $28,800, followed by $28,600.
Major Resistance Levels – $29,420, $29,600, and $30,000.