

Bitcoin price is correcting losses from the $27,660 zone. BTC is now facing strong resistance near the $28,800 and $29,000 levels.
- Bitcoin is attempting a fresh increase above the $28,500 resistance zone.
- The price is trading below $28,800 and the 100 hourly Simple moving average.
- There is a connecting bullish trend line forming with support near $28,200 on the hourly chart of the BTC/USD pair (data feed from Kraken).
- The pair could decline again if it fails to surpass the $28,800 resistance zone.
Bitcoin Price Upsides Capped
Bitcoin price formed a base and started a recovery wave above the $28,000 resistance zone. BTC climbed above the $28,200 resistance zone to move into a short-term bullish zone.
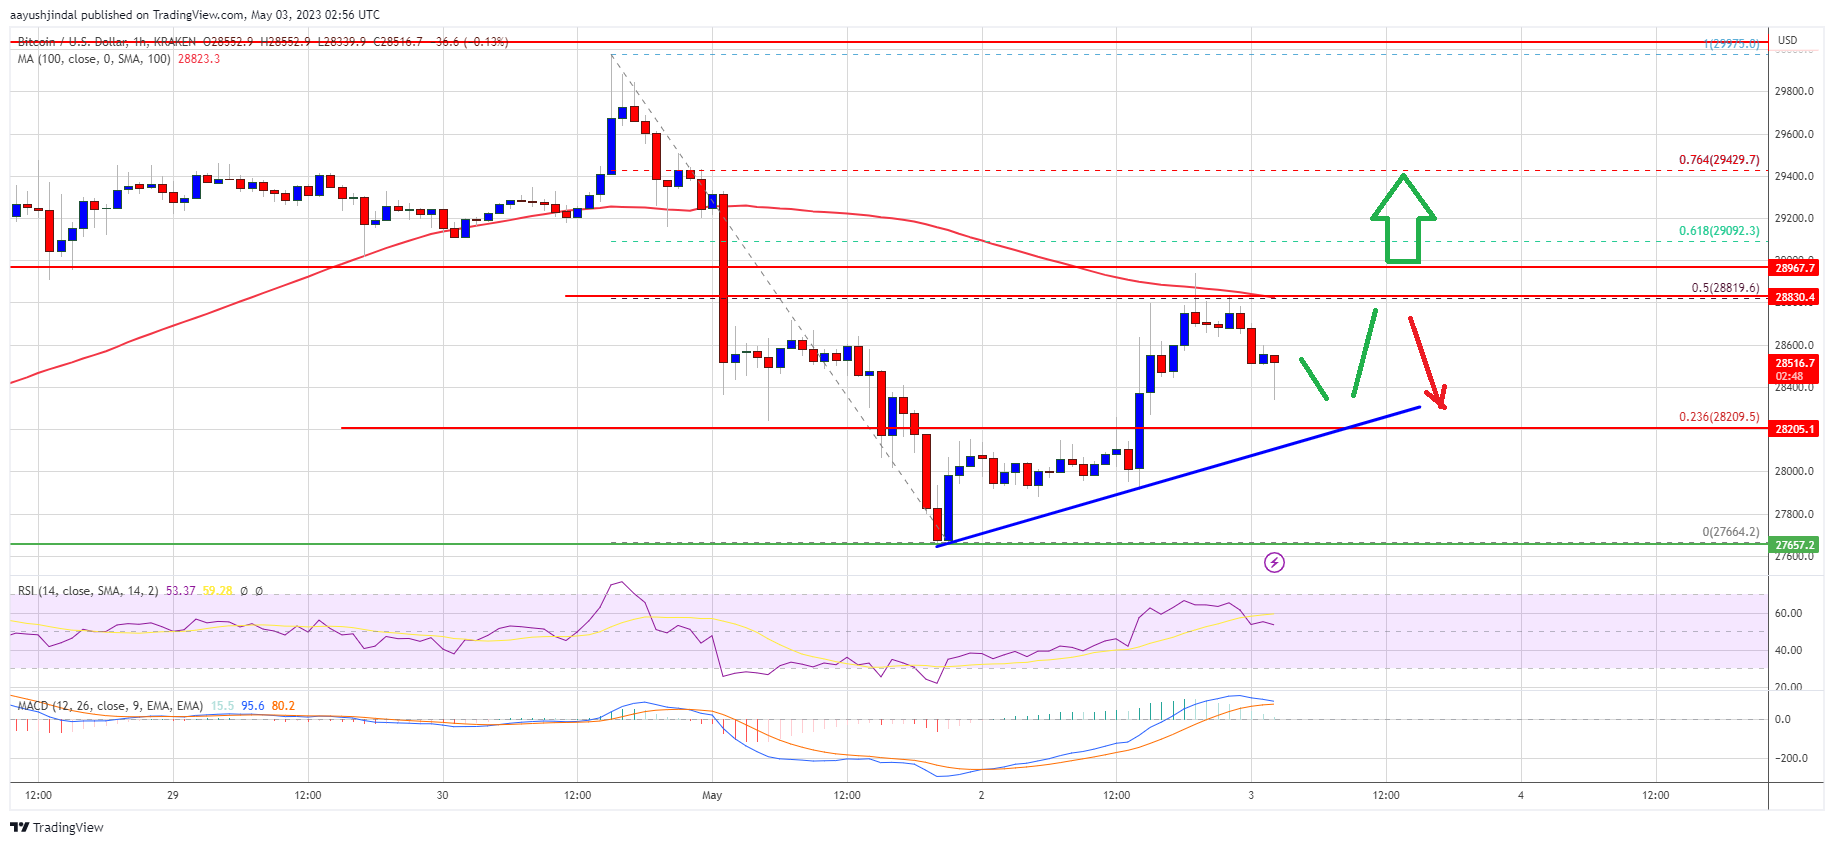
There was a move above the 23.6% Fib retracement level of the key drop from the $29,975 swing high to the $27,665 low. However, the bulls faced a strong resistance near the $28,800 zone and the 100 hourly Simple moving average.
Bitcoin price was rejected near the 50% Fib retracement level of the key drop from the $29,975 swing high to the $27,665 low. It is now trading below $28,800 and the 100 hourly Simple moving average.
Besides, there is a connecting bullish trend line forming with support near $28,200 on the hourly chart of the BTC/USD pair. Immediate resistance is near the $28,800 level. The next major resistance sits near the $29,000 zone and the $29,080 level.
Source: BTCUSD on TradingView.com
A close above the $29,000 resistance could send Bitcoin further higher. In the stated case, the price may perhaps rise toward the $29,500 level. Any more gains could open the doors for a test of the key barrier at $30,000.
Another Drop in BTC?
If Bitcoin’s price fails to clear the $28,800 resistance, it could start another decline. Immediate support on the downside is near the $28,200 level and the trend line.
The next major support is near the $27,660 zone or the recent swing low, below which the price might drop toward the $27,200 support zone. Any more losses might take Bitcoin toward $26,500 in the near term.
Technical indicators:
Hourly MACD – The MACD is now losing pace in the bullish zone.
Hourly RSI (Relative Strength Index) – The RSI for BTC/USD is now above the 50 level.
Major Support Levels – $28,200, followed by $27,660.
Major Resistance Levels – $28,800, $29,000, and $29,500.