

Bitcoin price is still struggling to clear the $21,500 resistance zone. BTC could correct further lower if there is a clear move below the $20,500 support zone.
- Bitcoin struggled to clear the $21,500 resistance zone and corrected lower.
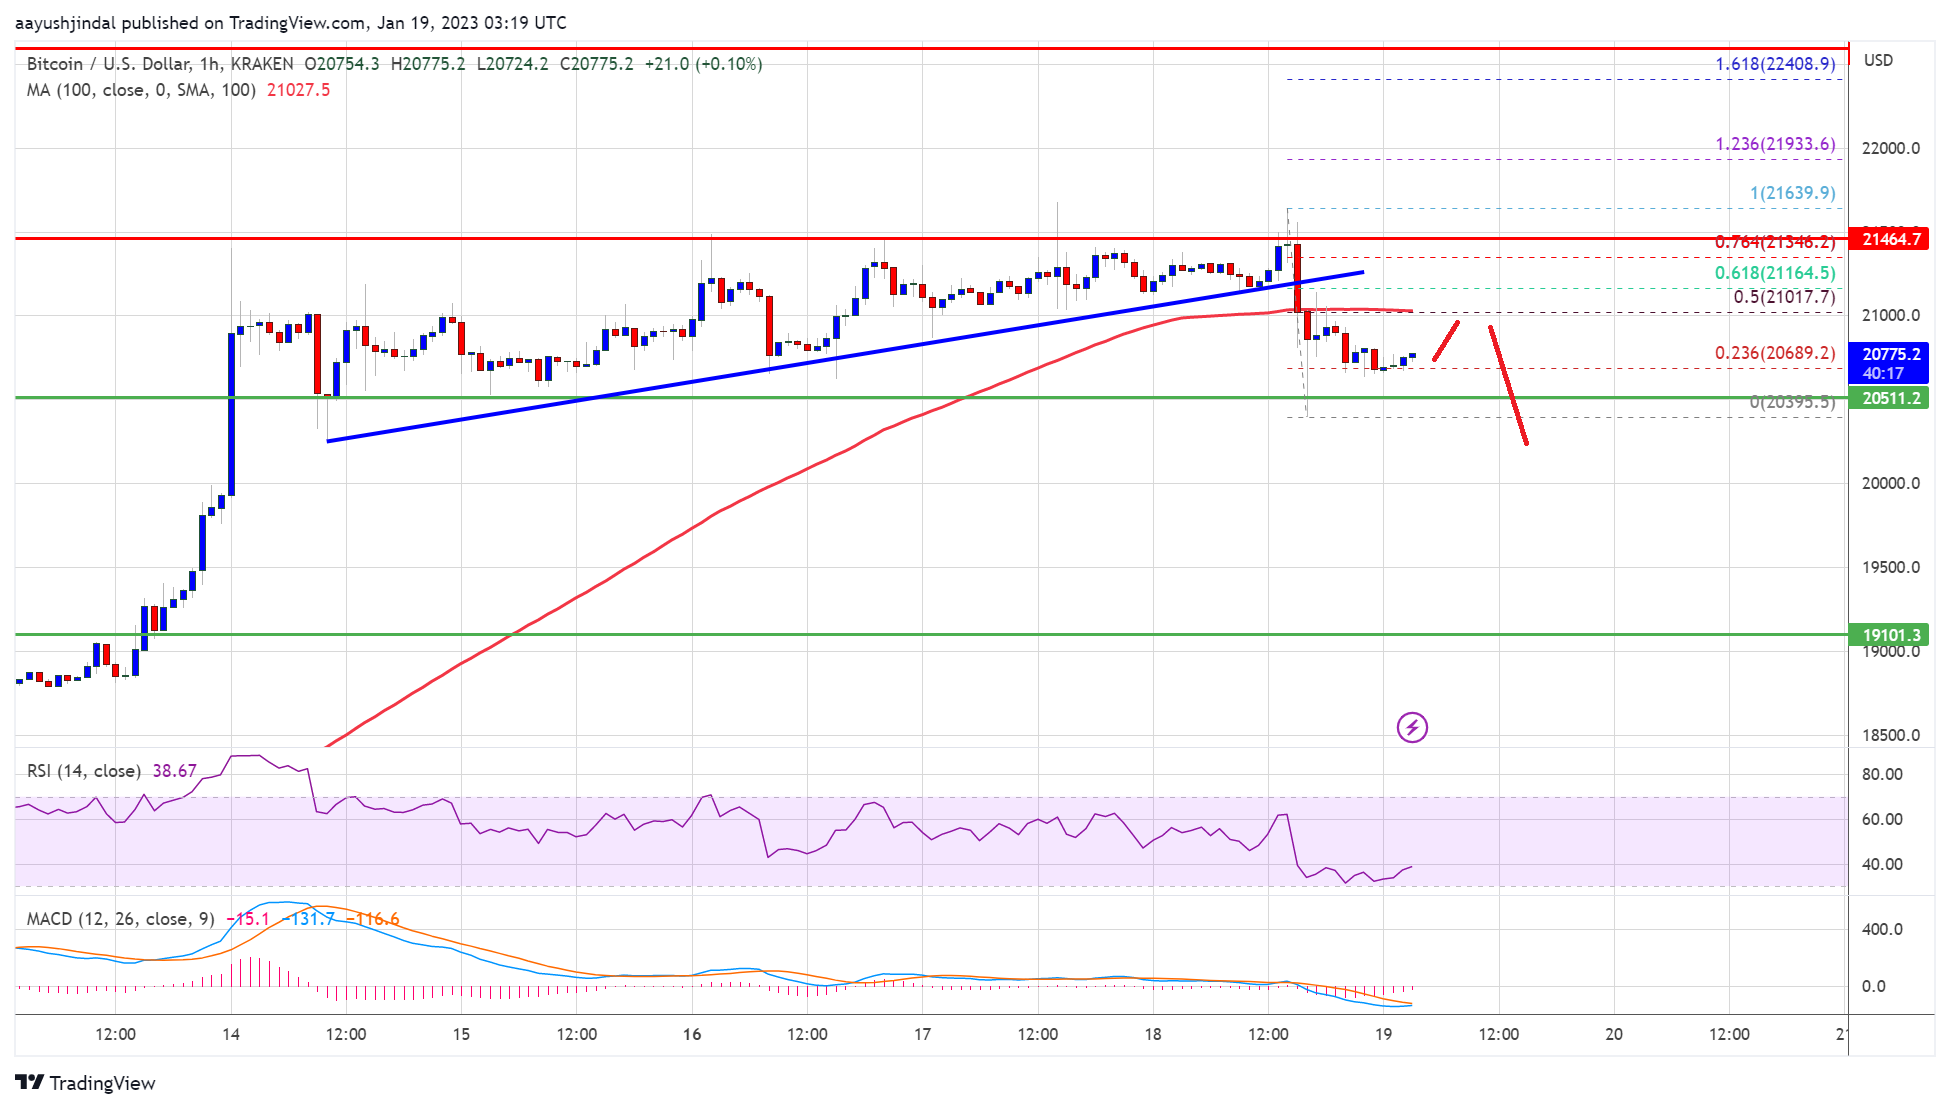
- The price is trading below $21,000 and the 100 hourly simple moving average.
- There was a break below a key bullish trend line with support near $21,150 on the hourly chart of the BTC/USD pair (data feed from Kraken).
- The pair could continue to move down below the $20,650 and $20,500 support levels.
Bitcoin Price Starts Downside Correction
Bitcoin price failed to clear the key hurdle near the $21,500 resistance zone. BTC started a downside correction from the $21,639 swing high. It traded below the $21,500 and $21,250 levels.
There was a break below a key bullish trend line with support near $21,150 on the hourly chart of the BTC/USD pair. The price even broke the $20,800 support zone. A low is formed near $20,395 and the price is now showing a few bearish signs.
Bitcoin price is now trading below $21,000 and the 100 hourly simple moving average. It is consolidating above the 23.6% Fib retracement level of the recent decline from the $21,639 swing high to $20,395 low.
An immediate resistance is near the $20,850 level. The next major resistance is near the $21,080 zone. It is near the 50% Fib retracement level of the recent decline from the $21,639 swing high to $20,395 low, above which the price might gain bullish momentum.
Source: BTCUSD on TradingView.com
In the stated case, the price may perhaps rise towards the $21,500 level. Any more gains might send btc price towards the $22,000 level.
More Losses in BTC?
If bitcoin price fails to clear the $21,080 resistance, it could continue to move down. An immediate support on the downside is near the $20,600 zone.
The next major support is near the $20,500 zone, below which the price might accelerate lower towards $20,000. Any more losses might send the price to $19,500, where the bulls may possibly take a stand.
Technical indicators:
Hourly MACD – The MACD is now losing pace in the bearish zone.
Hourly RSI (Relative Strength Index) – The RSI for BTC/USD is now below the 50 level.
Major Support Levels – $20,500, followed by $20,000.
Major Resistance Levels – $21,080, $21,250 and $21,500.