

Bitcoin price is facing a major hurdle near the $21,500 zone. BTC could correct lower if there is a clear move below the $20,500 support zone.
- Bitcoin seems to be facing a major challenge near the $21,450 and $21,500 levels.
- The price is trading above $20,600 and the 100 hourly simple moving average.
- There was a break below a major bullish trend line with support near $21,100 on the hourly chart of the BTC/USD pair (data feed from Kraken).
- The pair could start a downside correction below the $20,800 and $20,500 support levels.
Bitcoin Price Keeps Struggling
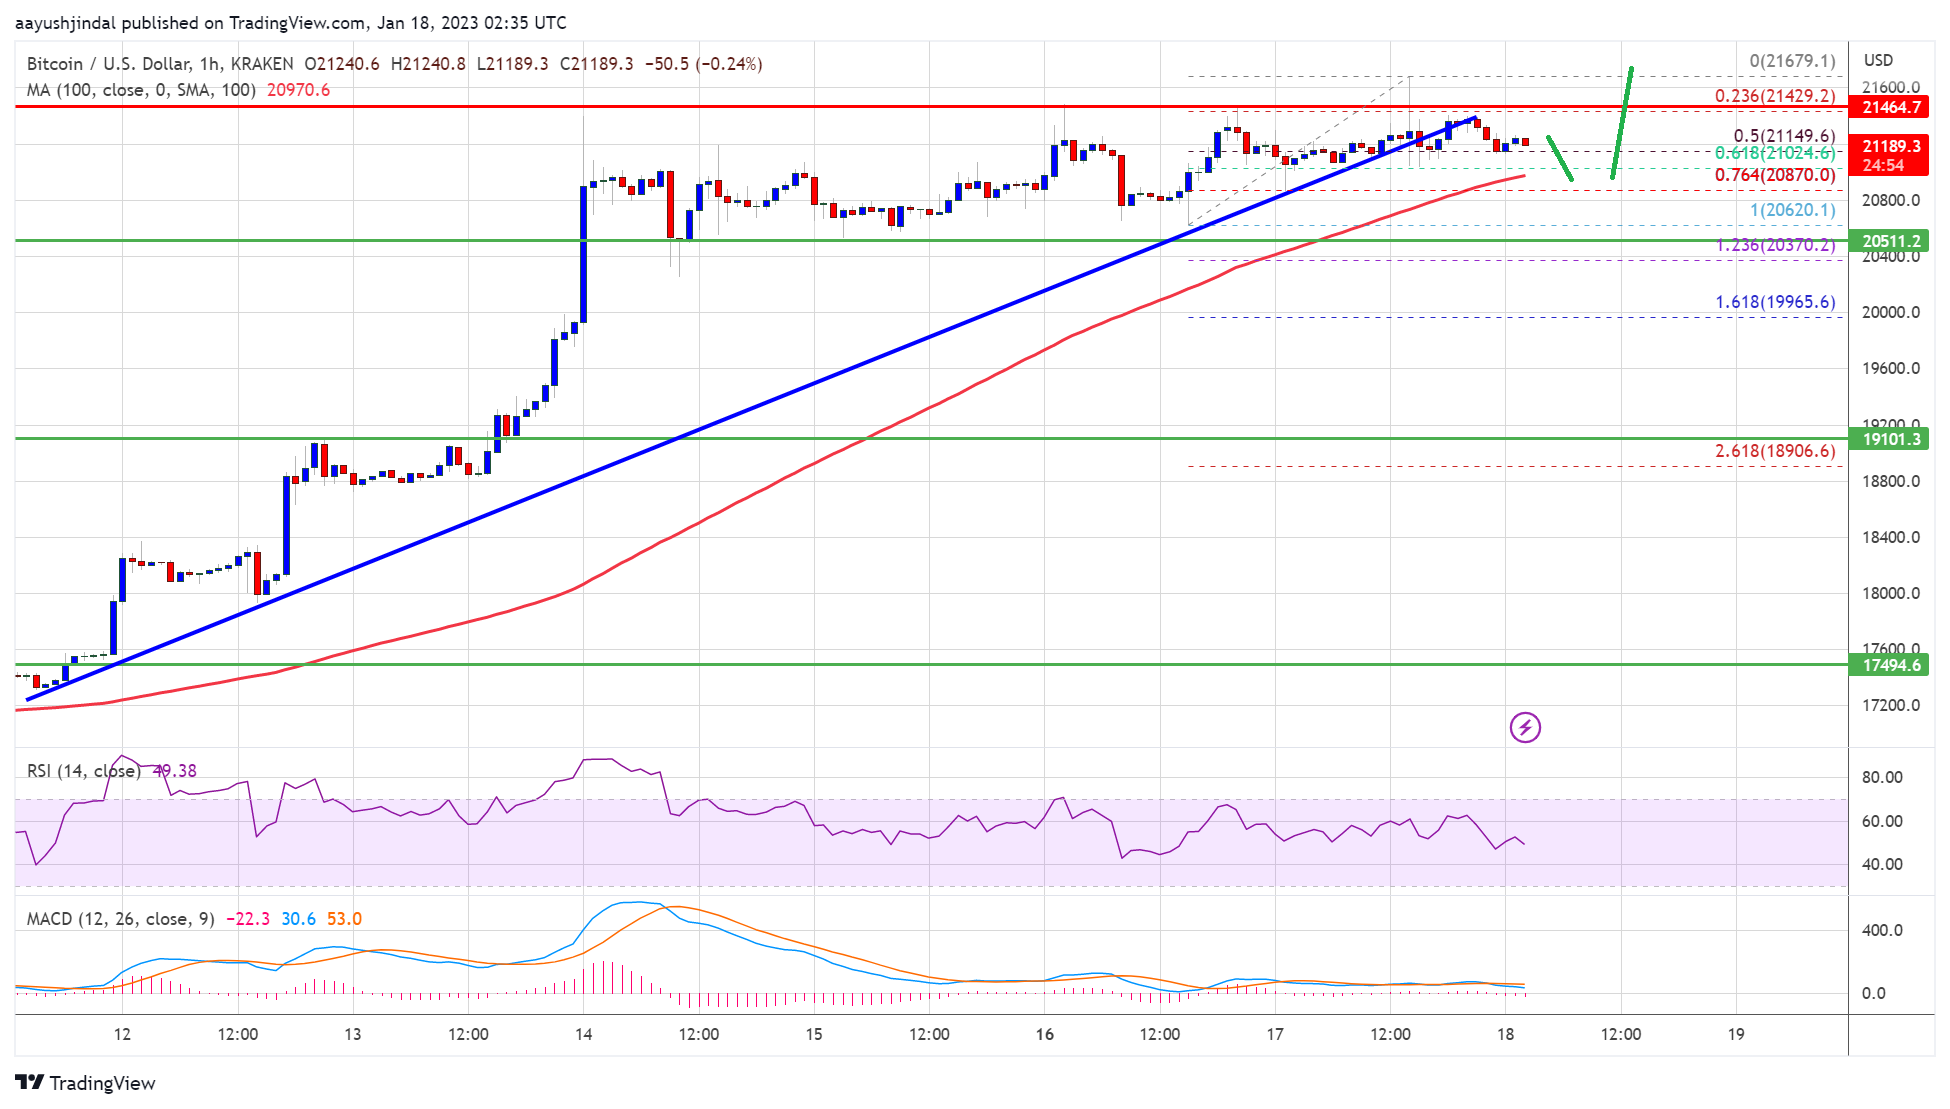
Bitcoin price attempted an upside break above the $21,500 resistance zone. However, BTC failed to gain pace above the $21,500 zone. A high was formed near $21,679 and the price is now slowly moving lower.
There was a break below the $21,250 level. The price declined below the 23.6% Fib retracement level of the recent increase from the $20,620 swing low to $21,679 high. There was a break below a major bullish trend line with support near $21,100 on the hourly chart of the BTC/USD pair.
Bitcoin price is now trading above $20,600 and the 100 hourly simple moving average. If there is another upside break attempt, an immediate resistance is near the $21,450 level. The next major resistance is near the $21,500 zone, above which the price might gain bullish momentum.
Source: BTCUSD on TradingView.com
In the stated case, the price may perhaps rise towards the $21,800 level. Any more gains might send btc price towards the $22,000 level.
Downside Correction in BTC?
If bitcoin price fails to clear the $21,500 resistance, it could continue to move down. An immediate support on the downside is near the $21,100 zone.
The next major support is near the $20,900 zone and the 100 hourly SMA. It is near the 61.8% Fib retracement level of the recent increase from the $20,620 swing low to $21,679 high. The main support is now forming near the $20,500 level, below which the price might accelerate lower towards $20,000. Any more losses might send the price to $19,500.
Technical indicators:
Hourly MACD – The MACD is now losing pace in the bullish zone.
Hourly RSI (Relative Strength Index) – The RSI for BTC/USD is now near the 50 level.
Major Support Levels – $20,900, followed by $20,500.
Major Resistance Levels – $21,450, $21,500 and $22,000.