

MATIC price started a fresh increase from the $0.80 support zone. Polygon bulls are now aiming a another increase above the $1.05 resistance zone.
- MATIC price started a decent increase above the $0.85 resistance against the US dollar.
- The price is trading above $0.92 and the 100 simple moving average (4-hours).
- There is a key bullish trend line forming with support near $0.955 on the 4-hours chart of the MATIC/USD pair (data source from Kraken).
- The pair could continue to rise towards the $1.08 and $1.20 resistance levels.
Polygon’s MATIC Price Eyes More Upsides
This past month, polygon’s price declined below the $0.80 support zone. MATIC even broke the $0.75 support zone and the 100 simple moving average (4-hours).
However, the bulls were active near the $0.70 support zone. A base was formed above the $0.75 level and the price started a fresh increase. The price was able to clear the $0.80 and $0.85 resistance levels. The bulls took control above the $0.90 level and the 100 simple moving average (4-hours).
Finally, the price spiked above the $1.0 level, outperforming bitcoin and ethereum. A high is formed near $1.05 and the price is now consolidating gains. It is trading above $0.92 and the 100 simple moving average (4-hours).
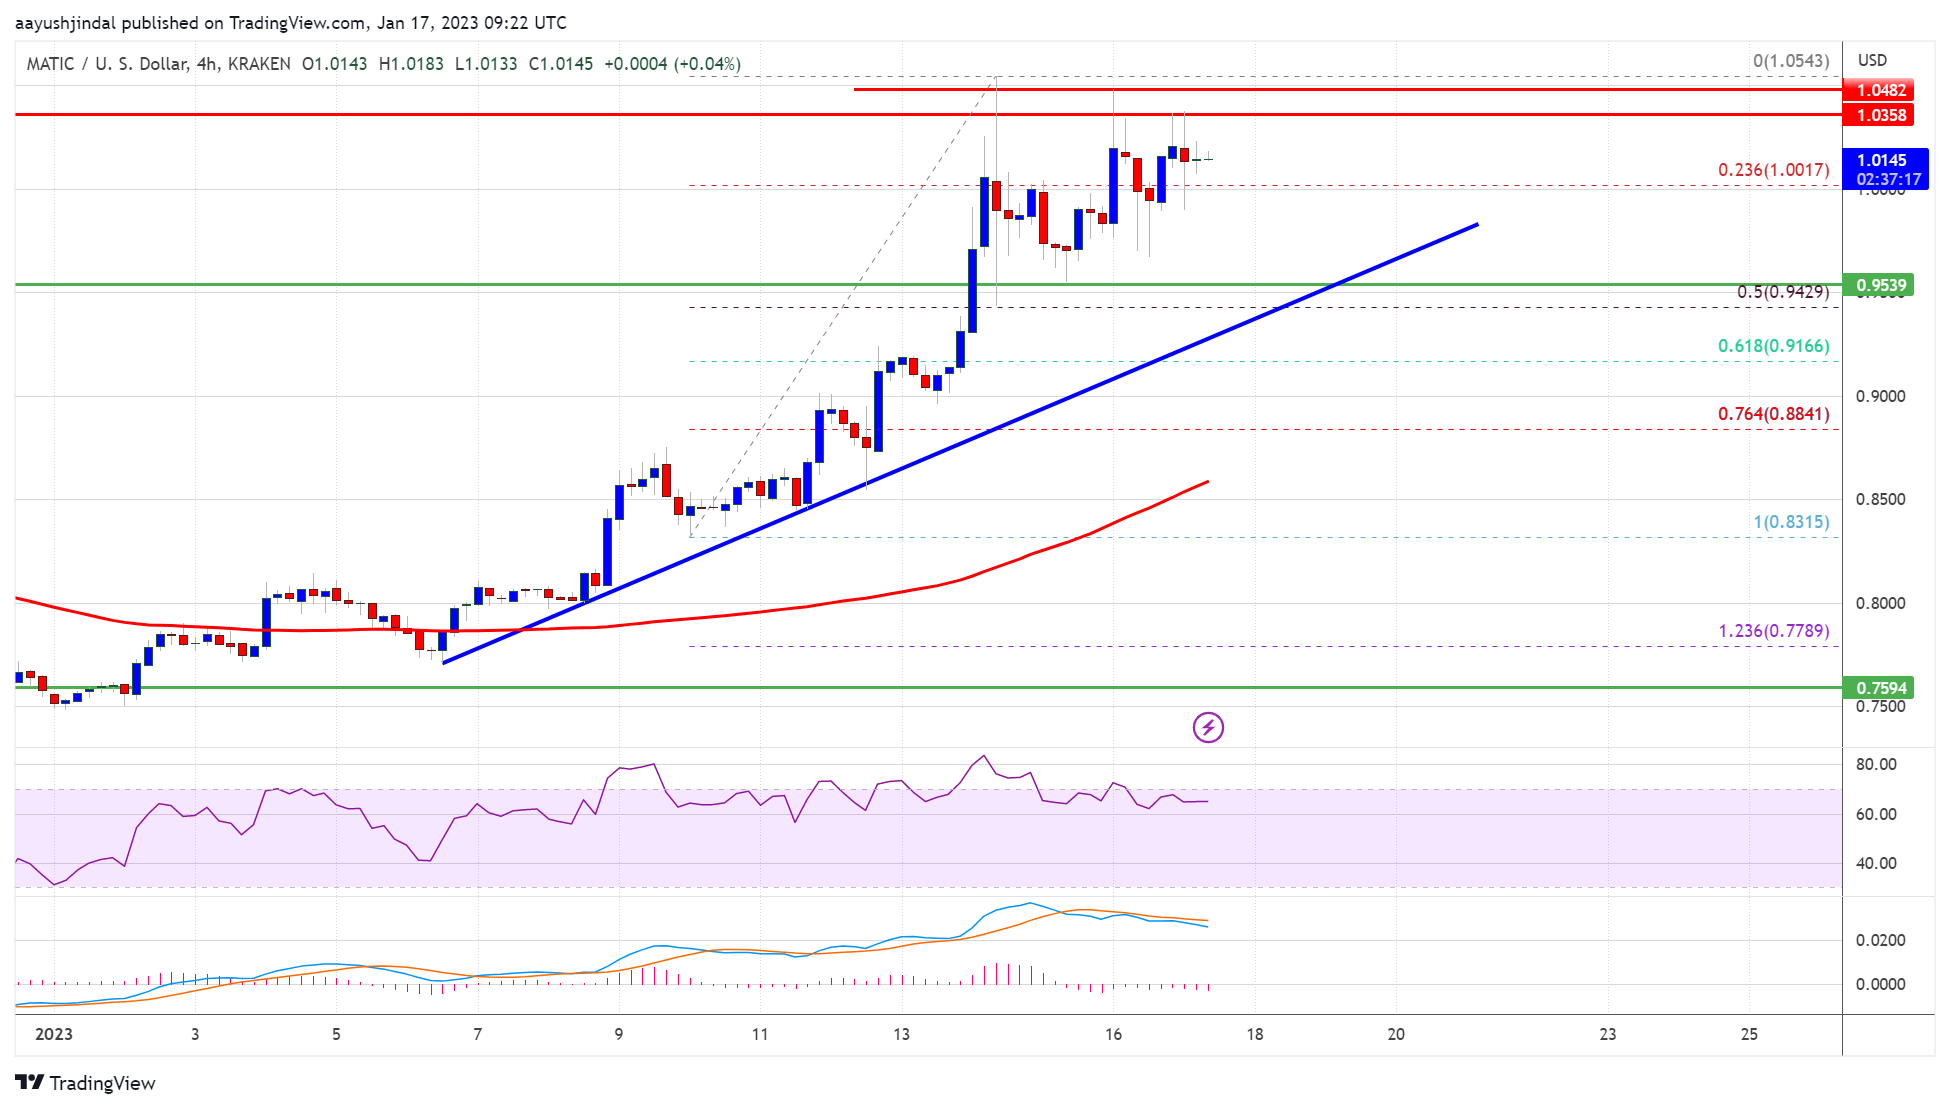
MATIC price is also trading above the 23.6% Fib retracement level of the upward move from the $0.831 swing low to $1.054 high. On the upside, an immediate resistance is near the $1.02 level. The first major resistance is forming near the $1.05 zone.
Source: MATICUSD on TradingView.com
If there is an upside break above the $1.02 and $1.05 resistance levels, the price could start another strong increase. In the stated case, the price could rise steadily towards the $1.20 level.
Dips Limited in MATIC?
If MATIC price fails to rise above the $1.02 and $1.05 resistance levels, it could start a downside correction. An immediate support on the downside is near the $1.0 level.
The main support is near the $0.950 level and a bullish trend line. A downside break below the $0.950 level could open the doors for a fresh decline towards $0.90. The next major support is near the $0.85 level.
Technical Indicators
4-hours MACD – The MACD for MATIC/USD is gaining momentum in the bullish zone.
4-hours RSI (Relative Strength Index) – The RSI for MATIC/USD is now above the 50 level.
Major Support Levels – $1.0 and $0.95.
Major Resistance Levels – $1.02, $1.05 and $1.20.