

Solana is showing bullish signs above $15 against the US Dollar. SOL price could extend its rally above the $18 and $20 resistance levels.
- Sol price started a fresh increase above the $15 and $16 levels against the US Dollar.
- The price is now trading above $16 and the 100 simple moving average (4-hours).
- There is a key bullish trend line forming with support near $15.90 on the 4-hours chart of the SOL/USD pair (data source from Kraken).
- The pair could rise further if it stays above the $15.00 and $12.80 support levels.
Solana Price Eyes More Gains
This week, solana price formed a base and started a steady increase above the $14 level. There was a strong increase above the $15 resistance zone, similar to bitcoin and ethereum.
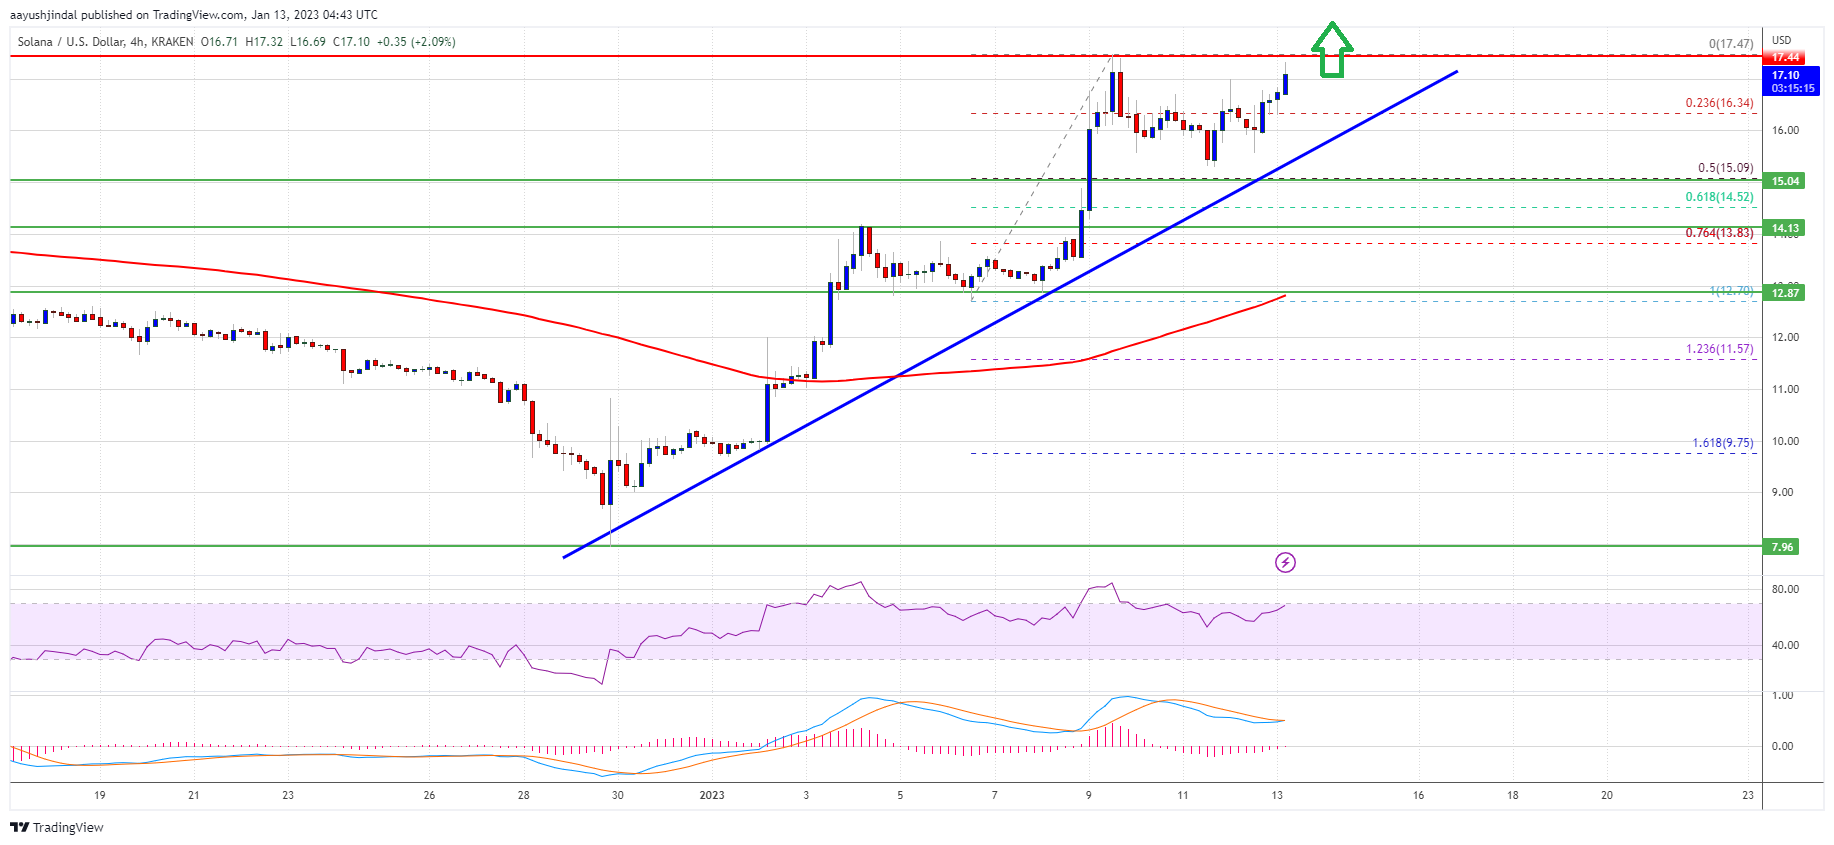
The bulls even managed to pump the price above the $16.50 resistance. It traded to a new yearly high at $17.47 and is currently consolidating gains. There was a minor correction below the 23.6% Fib retracement level of the upward wave from the $12.70 swing low to $17.47 high.
Sol price is now trading above $16 and the 100 simple moving average (4-hours). There is also a key bullish trend line forming with support near $15.90 on the 4-hours chart of the SOL/USD pair.
Source: SOLUSD on TradingView.com
On the upside, an immediate resistance is near the $17.50 level. The first major resistance is near the $18 level. The next major resistance is near the $18.80 zone, above which the price might rise towards the $20 barrier. Any more gains might send the price towards the $25 level.
Dips Attractive in SOL?
If SOL fails to clear the $18 resistance, it could start a downside correction. An initial support on the downside is near the $16.35 level.
The first major support is near the $15.00 level and the trend line. It is near the 50% Fib retracement level of the upward wave from the $12.70 swing low to $17.47 high. The next major support is near the $14.10 level. If there is a downside break below the $14.10 support, the price might test the next key support at $12.80.
Technical Indicators
4-Hours MACD – The MACD for SOL/USD is gaining pace in the bullish zone.
4-Hours RSI (Relative Strength Index) – The RSI for SOL/USD is above the 50 level.
Major Support Levels – $16.30, $15.00 and $14.10.
Major Resistance Levels – $17.40, $18 and $20.