

Ripple is gaining pace above the $0.350 resistance zone against the US Dollar. XRP price could rise further if it clears the $0.3720 resistance zone.
- Ripple is currently rising above the $0.35 resistance zone against the US dollar.
- The price is now trading above $0.350 and the 100 simple moving average (4-hours).
- There was a break above a crucial bearish trend line with resistance near $0.3495 on the 4-hours chart of the XRP/USD pair (data source from Kraken).
- The pair could rise further higher if there is a clear move above the $0.3720 resistance zone.
Ripple Price Extends Gains
After a sharp decline, ripple’s XRP found support near the $0.3000 zone against the US Dollar. The price formed a base above the $0.3050 level before it started a recovery wave.
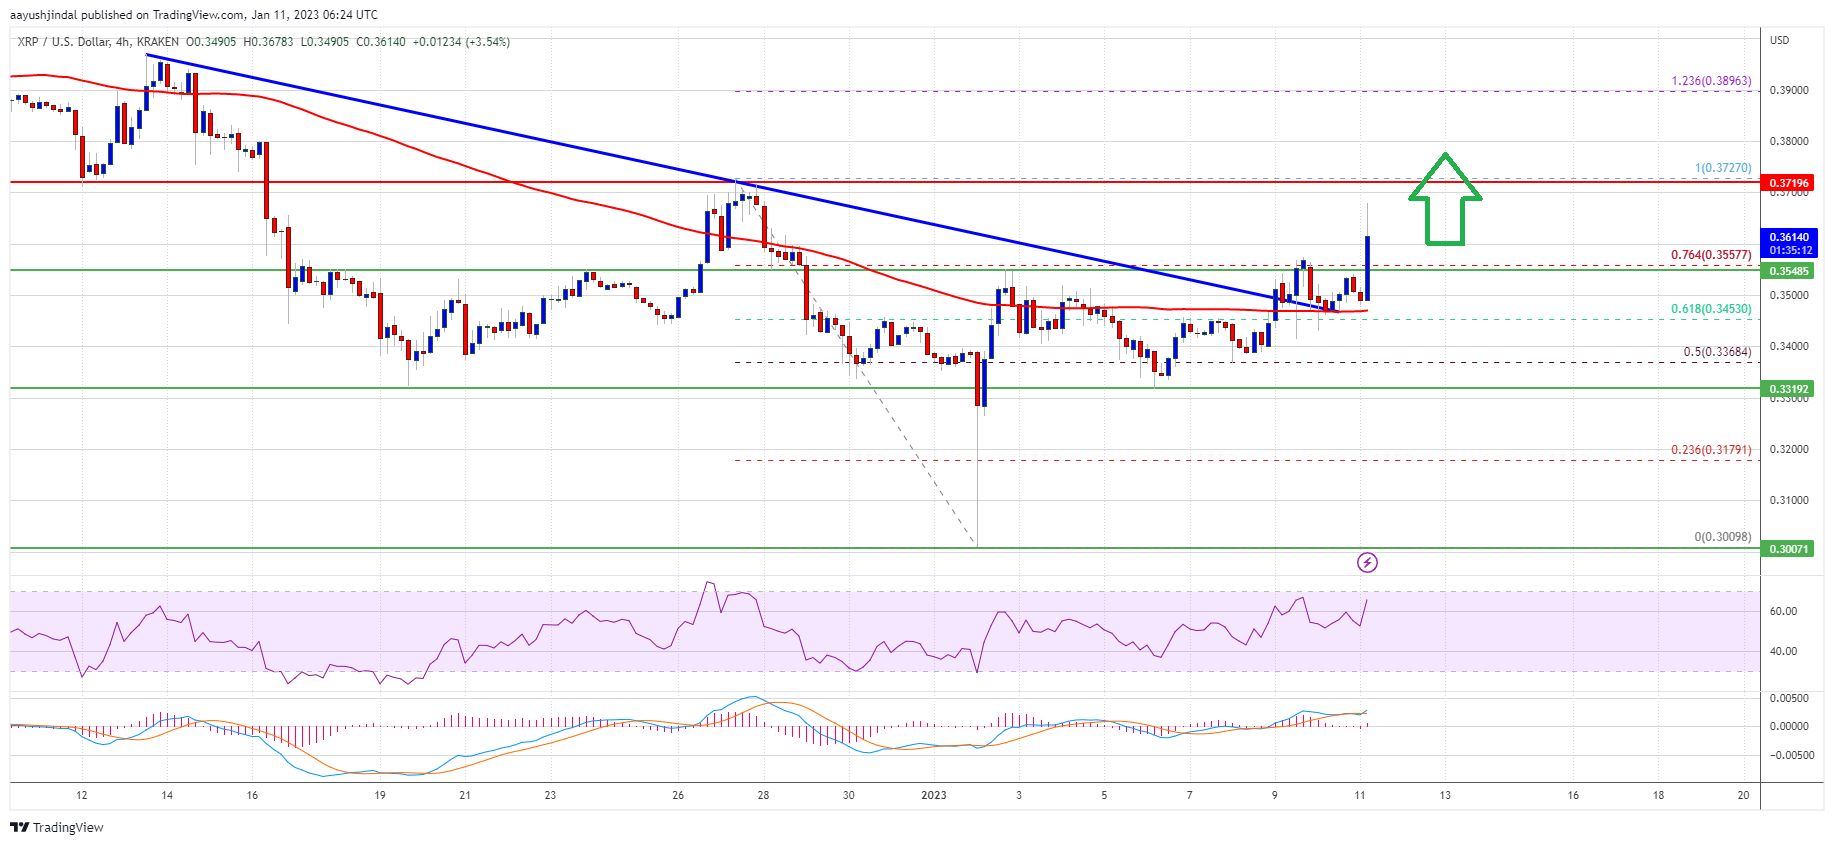
There was a decent increase above the $0.3250 and $0.3300 resistance levels. Besides, there was a break above a crucial bearish trend line with resistance near $0.3495 on the 4-hours chart of the XRP/USD pair. The upward move gained pace above the $0.350 level.
The price is now trading above the 76.4% Fib retracement level of the main drop from the $0.3727 swing high to $0.3009 low. It is also trading above $0.350 and the 100 simple moving average (4-hours), outperforming bitcoin and ethereum.
An immediate resistance is near the $0.372 zone. The next key resistance is near the $0.390 level. It is near the 1.236 Fib extension level of the main drop from the $0.3727 swing high to $0.3009 low.
Source: XRPUSD on TradingView.com
A successful break above the $0.390 resistance might send the price towards the $0.400 resistance. Any more gains might send the price towards the $0.432 level in the coming days.
Fresh Decline in XRP?
If ripple fails to clear the $0.372 resistance zone, it could start a downside correction. An initial support on the downside is near the $0.355 level.
The next major support is near $0.345 and the 100 simple moving average (4-hours). If there is a downside break and close below the $0.345 level, xrp price could extend losses. In the stated case, the price could even decline below the $0.325 support.
Technical Indicators
4-Hours MACD – The MACD for XRP/USD is now gaining pace in the bullish zone.
4-Hours RSI (Relative Strength Index) – The RSI for XRP/USD is now above the 50 level.
Major Support Levels – $0.355, $0.345 and $0.325.
Major Resistance Levels – $0.372, $0.390 and $0.400.