

Ethereum extended its increase above the $1,300 resistance zone against the US Dollar. ETH tested the $1,350 zone and is currently correcting lower.
- Ethereum remained in a positive zone and climbed above the $1,300 and $1,320 resistance levels.
- The price is now trading above $1,300 and the 100 hourly simple moving average.
- There is a major bullish trend line forming with support near $1,292 on the hourly chart of ETH/USD (data feed via Kraken).
- The pair could rise further if it stays above the $1,280 support zone.
Ethereum Price Faces Resistance
Ethereum price started a decent increase above the $1,280 level. ETH gained pace and was able to clear the $1,300 resistance zone to move into a positive zone, similar to bitcoin above $17,000.
The price even broke the $1,320 zone to extend its increase. Ether traded to a new yearly high at $1,343 and slowly lost momentum. It seems like the price climbed above the $1,320 level on a decreasing trading volume. As a result, there was a pullback below the $1,325 level.
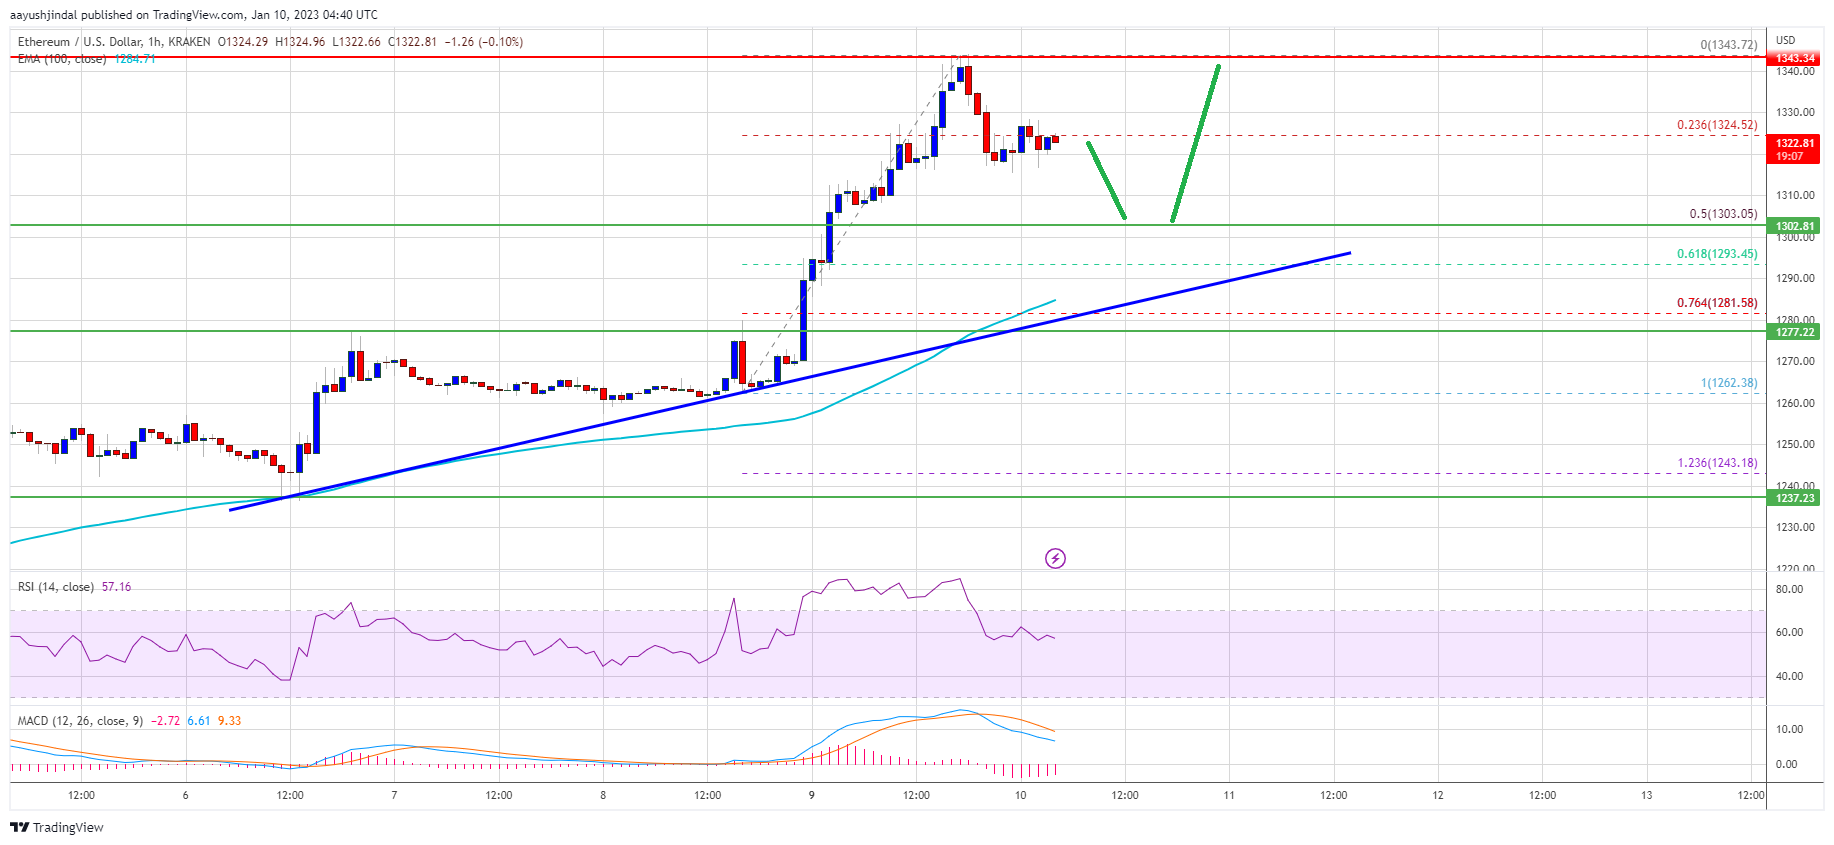
The price declined below the 23.6% Fib retracement level of the upward move from the $1,262 swing low to $1,343 high. Ether is still trading above $1,300 and the 100 hourly simple moving average.
There is also a major bullish trend line forming with support near $1,292 on the hourly chart of ETH/USD. An immediate resistance is near the $1,330 level. The next major resistance is near the $1,350 level. A clear move above the $1,350 resistance could another decent increase.
Source: ETHUSD on TradingView.com
In the stated case, the price may perhaps climb higher towards the $1,400 resistance. The next major resistance could be $1,450, above which the price could surge towards the $1,500 resistance zone.
Dips Supported in ETH?
If ethereum fails to clear the $1,330 resistance, it could continue to move lower. An initial support on the downside is near the $1,305 level.
The next major support is near the $1,292 level and the trend line. It is near the 61.8% Fib retracement level of the upward move from the $1,262 swing low to $1,343 high. A downside break below the trend line support might call for a move towards the $1,280 support. Any more losses might call for a test of the $1,250 zone.
Technical Indicators
Hourly MACD – The MACD for ETH/USD is now losing momentum in the bullish zone.
Hourly RSI – The RSI for ETH/USD is now above the 50 level.
Major Support Level – $1,280
Major Resistance Level – $1,350