

Ethereum is still consolidating below the $1,230 resistance against the US Dollar. ETH could react to the downside if it stays below $1,230 for a long time.
- Ethereum is attempting an upside break above the $1,230 resistance zone.
- The price is now trading above $1,200 and the 100 hourly simple moving average.
- There was a break above a connecting bearish trend line with resistance near $1,218 on the hourly chart of ETH/USD (data feed via Kraken).
- The pair could gain bullish momentum if there is a close above $1,230 and $1,250.
Ethereum Price Faces Key Barrier
Ethereum price started a recovery wave above the $1,180 and $1,190 levels. ETH even managed to climb above the $1,200 resistance zone and the 100 hourly simple moving average, similar to bitcoin.
There was a break above a connecting bearish trend line with resistance near $1,218 on the hourly chart of ETH/USD. The bulls even attempted to clear the key $1,230 resistance zone, but they struggled. It seems like there are already many attempts to clear the $1,230 and $1,250 resistance levels.
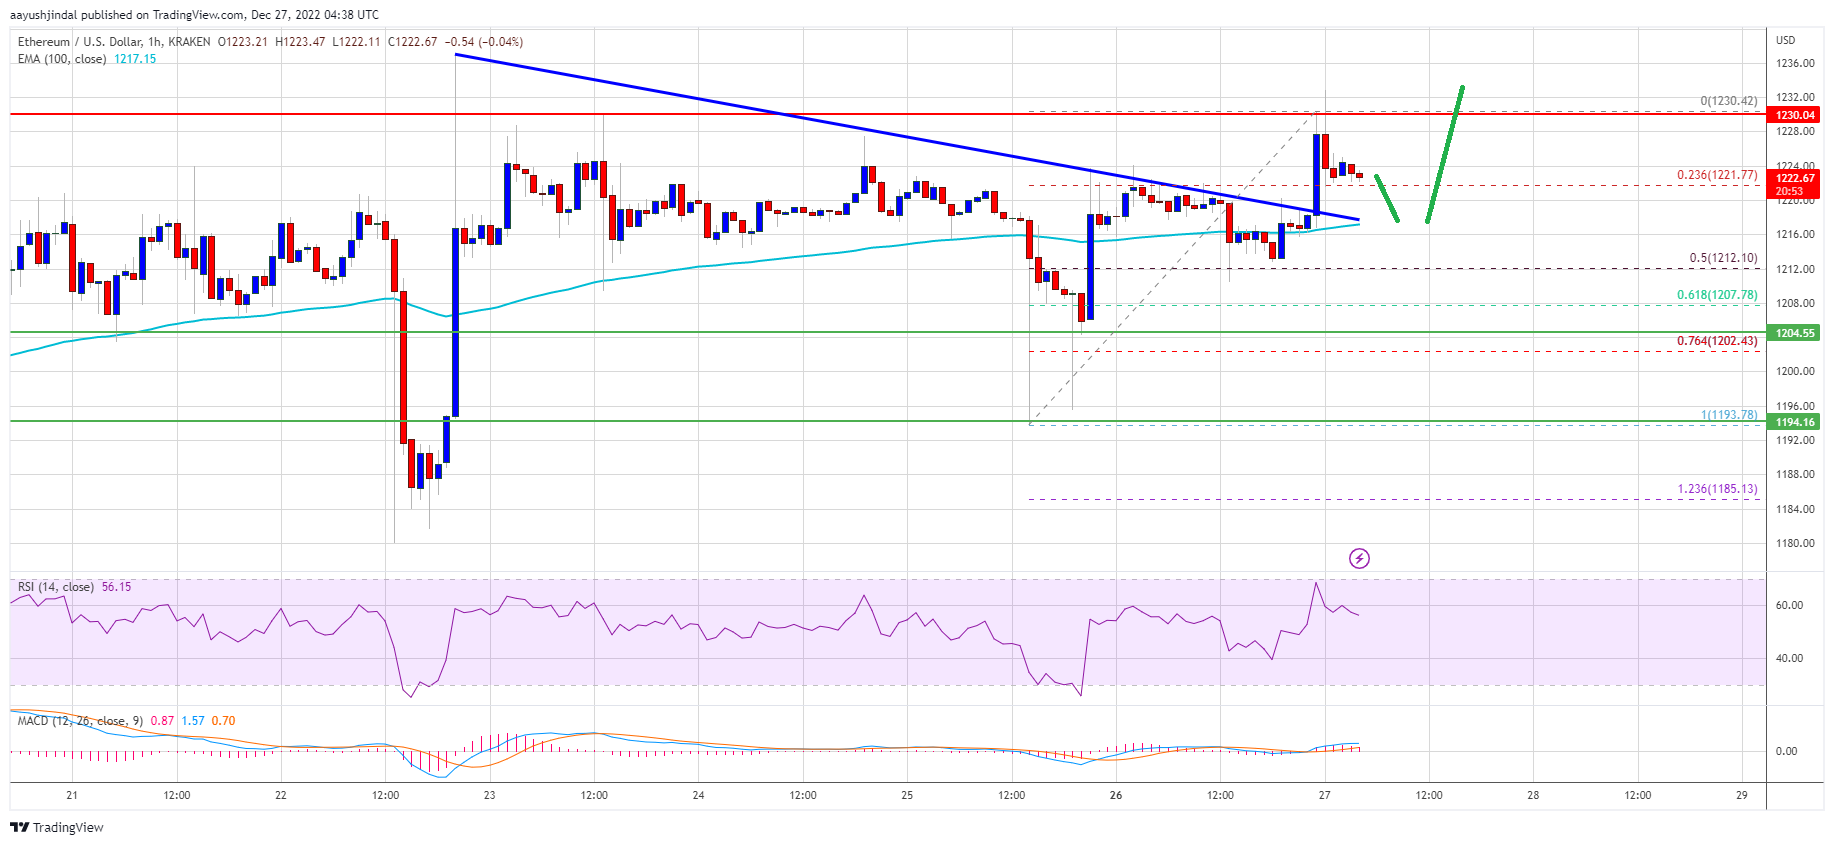
Ether price is now trading above $1,200 and the 100 hourly simple moving average. It is trading near the 23.6% Fib retracement level of the recent increase from the $1,193 swing low to $1,230 high.
An immediate key barrier is near the $1,230 level. The next major resistance is near the $1,250 level. A close above the $1,250 resistance could start a steady increase. In the stated case, the price may perhaps rise towards the $1,300 resistance.
Source: ETHUSD on TradingView.com
The next major resistance could be $1,350, above which the price could accelerate higher towards $1,400. Any more gains might send the price towards the $1,500 resistance zone.
ETH Could Trim Gains
If ethereum fails to climb above the $1,230 resistance, it could start another drop. An initial support on the downside is near the $1,216 level and the 100 hourly simple moving average.
The next major support is near the $1,210 level. The first major support is near the $1,200 level or the 61.8% Fib retracement level of the recent increase from the $1,193 swing low to $1,230 high. A downside break below $1,200 might spark a move towards the $1,180 support. Any more losses could lead the price towards the $1,150 zone.
Technical Indicators
Hourly MACD – The MACD for ETH/USD is now losing momentum in the bullish zone.
Hourly RSI – The RSI for ETH/USD is now above the 50 level.
Major Support Level – $1,200
Major Resistance Level – $1,230