

Ethereum remained in a bearish zone below the $1,250 resistance against the US Dollar. ETH is attempting a recovery wave, but the 100 hourly SMA is the key.
- Ethereum made another to clear the $1,150 support, but the bulls were active.
- The price is now trading below $1,200 and the 100 hourly simple moving average.
- There was a break above a key bearish trend line with resistance near $1,165 on the hourly chart of ETH/USD (data feed via Kraken).
- The pair could start a decent recovery wave if there is a move above the $1,200 resistance.
Ethereum Price Faces Hurdle
Ethereum price moved into a bearish zone below the $1,250 pivot level. ETH gained bearish momentum below the $1,200 level and the 100 hourly simple moving average, similar to bitcoin.
The price spiked and tested the $1,150 support. The bears made two attempts to push ether price below the $1,150 support, but failed. The recent low was formed near $1,150 and the price started a short-term upside correction.
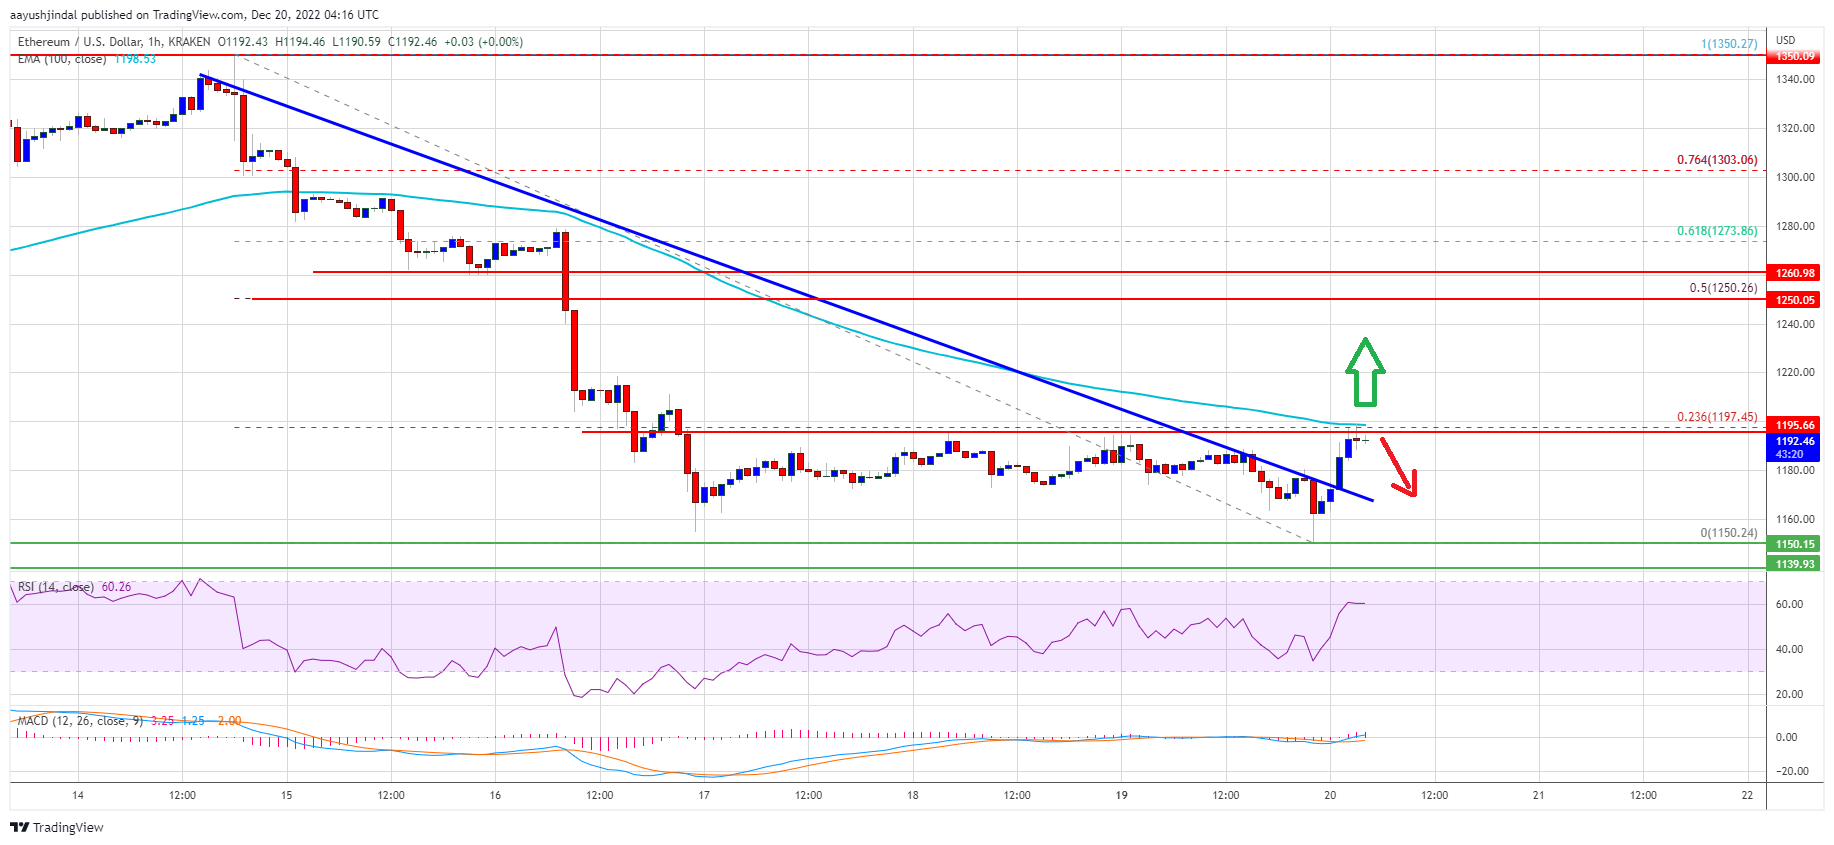
There was a move above the $1,165 resistance. Besides, there was a break above a key bearish trend line with resistance near $1,165 on the hourly chart of ETH/USD.
Ether price is now facing resistance near $1,200 and the 100 hourly simple moving average. It is close to the 23.6% Fib retracement level of the main decline from the $1,350 swing high to $1,150 low. The first major resistance is near the $1,220 level.
Source: ETHUSD on TradingView.com
A close above the $1,220 resistance might start a decent recovery wave. The next major resistance could be $1,250 or the 50% Fib retracement level of the main decline from the $1,350 swing high to $1,150 low. If the bulls clear the $1,250 barrier, the price might rise towards $1,300. Any more gains might send the price towards the $1,350 resistance zone.
Fresh Decline in ETH?
If ethereum fails to climb above the $1,200 resistance, it could start another bearish wave. An initial support on the downside is near the $1,165 level.
The next major support is near the $1,150 level, below which the price could accelerate lower towards the $1,100 support. Any more losses could lead the price towards the $1,050 support.
Technical Indicators
Hourly MACD – The MACD for ETH/USD is now gaining momentum in the bullish zone.
Hourly RSI – The RSI for ETH/USD is now above the 50 level.
Major Support Level – $1,150
Major Resistance Level – $1,220