

Ethereum started a fresh decline from the $1,350 resistance against the US Dollar. ETH traded below $1,300 and is showing bearish signs.
- Ethereum started another decline and traded below the $1,300 support.
- The price is now trading below $1,290 and the 100 hourly simple moving average.
- There was a break below a major bullish trend line with support near $1,290 on the hourly chart of ETH/USD (data feed via Kraken).
- The pair could continue to move down unless the price climbs above the $1,300 resistance.
Ethereum Price Restarts Decline
Ethereum price failed to clear the $1,350 resistance zone. ETH formed a top near $1,350 and started a fresh decline. There was a clear move below the $1,300 support and the 100 hourly simple moving average, similar to bitcoin.
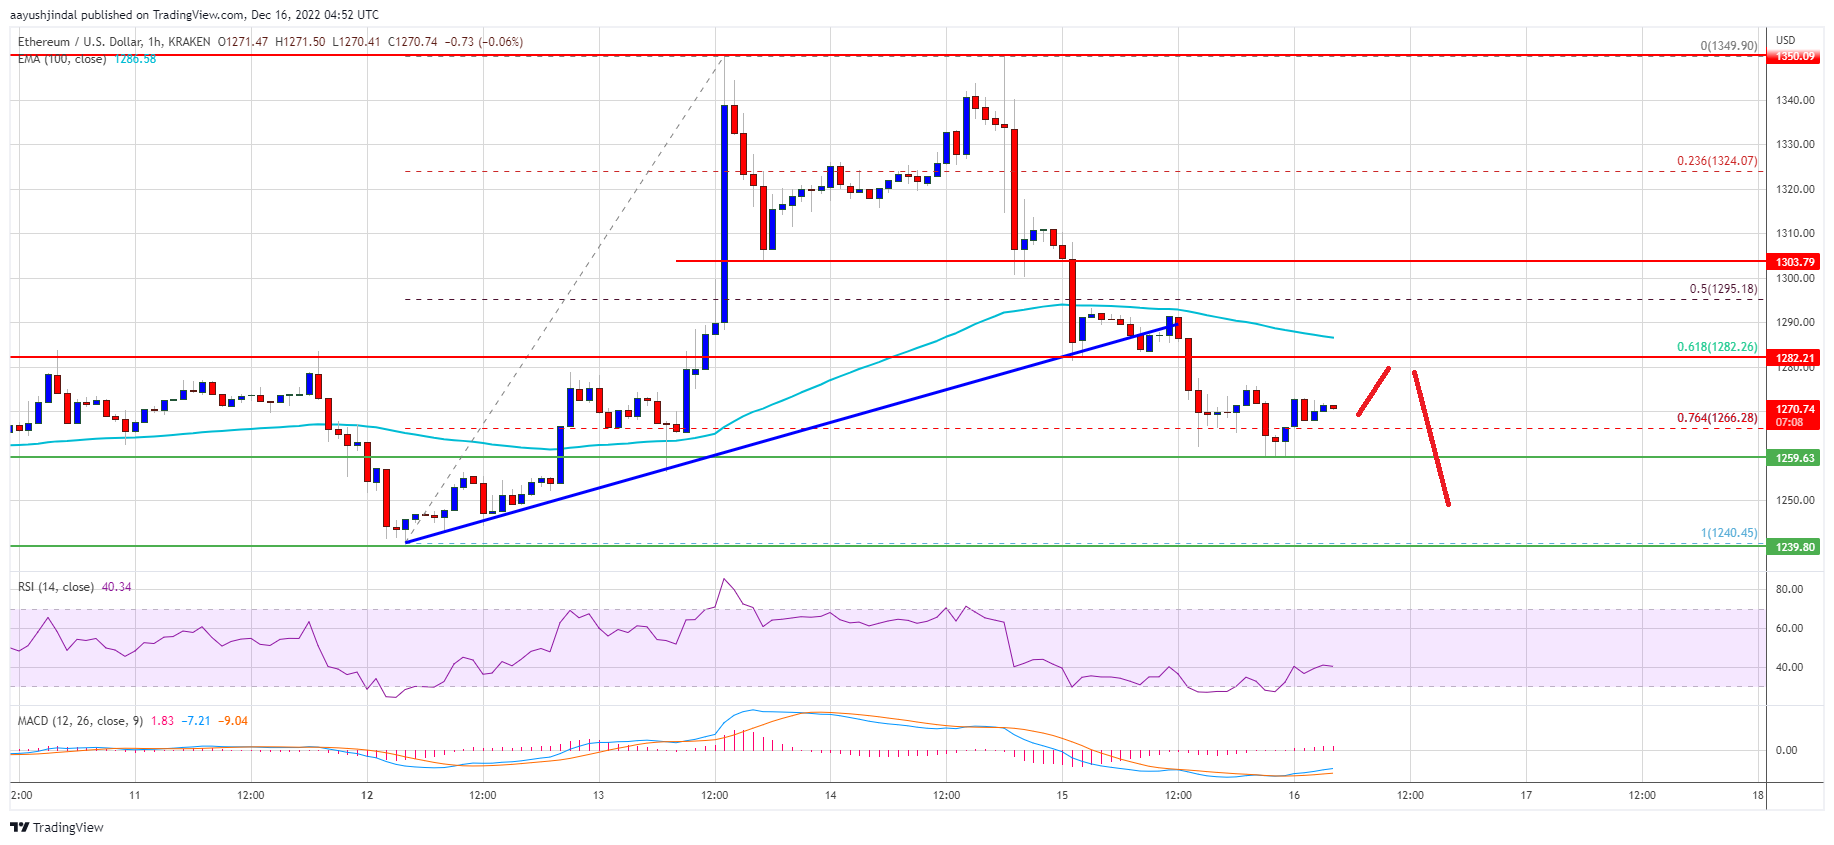
During the decline, there was a break below a major bullish trend line with support near $1,290 on the hourly chart of ETH/USD. The price settled below the 61.8% Fib retracement level of the upward wave from the $1,240 swing low to $1,349 swing high.
Ether price is now trading below $1,290 and the 100 hourly simple moving average. It is also consolidating near the 76.4% Fib retracement level of the upward wave from the $1,240 swing low to $1,349 swing high.
An immediate resistance on the upside is near the $1,285 level and the 100 hourly simple moving average. The first major resistance is near the $1,300 and $1,305 levels. A close above the $1,305 resistance might start a fresh increase.
Source: ETHUSD on TradingView.com
The next major resistance could be $1,350, above which ether could rise towards $1,400. Any more gains might send the price towards the $1,480 resistance zone.
More Losses in ETH?
If ethereum fails to climb above the $1,300 resistance, it could continue to move down. An initial support on the downside is near the $1,260 level.
The next major support is near the $1,240 level, below which the price could gain bearish momentum towards the $1,200 support. Any more losses could lead the price towards the $1,100 support.
Technical Indicators
Hourly MACD – The MACD for ETH/USD is now gaining momentum in the bearish zone.
Hourly RSI – The RSI for ETH/USD is now below the 50 level.
Major Support Level – $1,260
Major Resistance Level – $1,300