

Bitcoin price gained pace above the $17,500 resistance after the US CPI release. BTC tested the $18,000 resistance and might correct lower in the short-term.
- Bitcoin was able to clear the $17,450 and $17,500 resistance levels.
- The price is trading above $17,500 and the 100 hourly simple moving average.
- There was a break above a key contracting triangle with resistance near $17,240 on the hourly chart of the BTC/USD pair (data feed from Kraken).
- The pair could correct lower, but dips might be limited below the $17,500 support zone.
Bitcoin Price Rallies 5%
Bitcoin price remained strong above the $16,800 support zone. BTC formed a base and started a fresh increase above the $17,000 resistance zone and the 100 hourly simple moving average.
The price gained bullish momentum after the US CPI release (+7.1%) and rallied above the $17,500 resistance zone. There was a break above a key contracting triangle with resistance near $17,240 on the hourly chart of the BTC/USD pair.
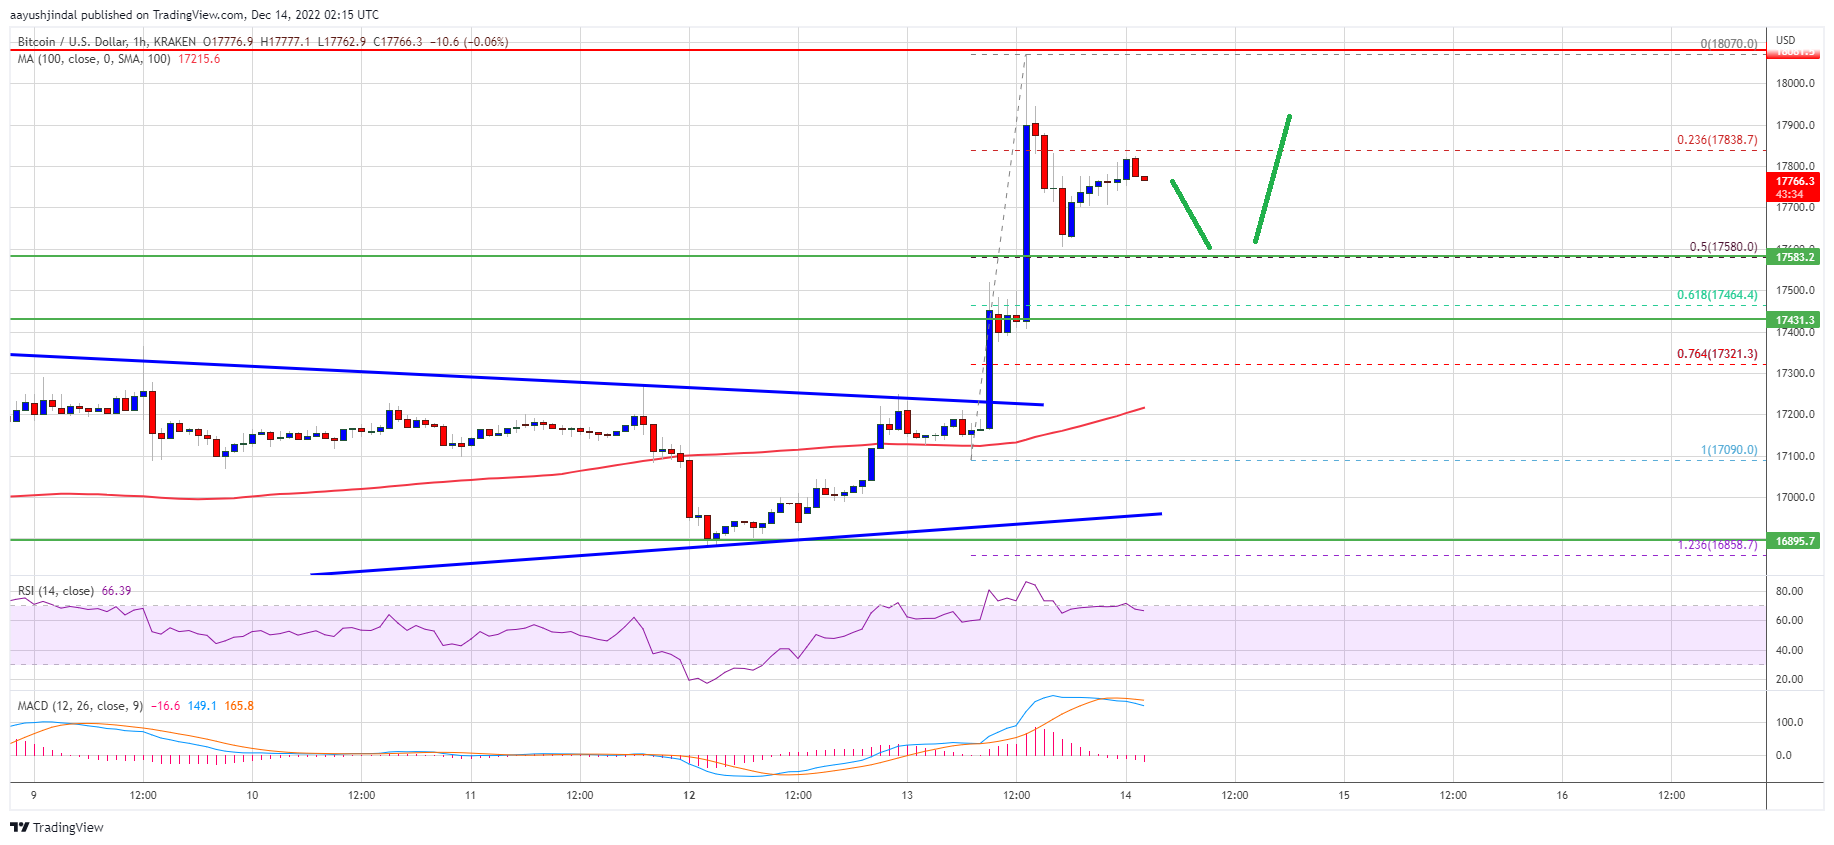
Bitcoin price is now trading above $17,500 and the 100 hourly simple moving average. A high was formed near $18,070 and the price is now correcting gains. It traded below the 23.6% Fib retracement level of the recent rally from the $17,090 low to $18,070 high.
However, the bulls were active above the $17,500 support zone. It remained stable above the 50% Fib retracement level of the recent rally from the $17,090 low to $18,070 high.
On the upside, an immediate resistance is near the $17,850 level. The first major resistance is near the $18,000 zone, above which the price may perhaps rise towards the $18,250 zone.
Source: BTCUSD on TradingView.com
The next major resistance is near $18,500, above which the price start a steady increase and rise towards the $19,200 zone in the near term.
Dips Supported in BTC?
If bitcoin fails to clear the $17,850 resistance, there could be a downside correction. An immediate support on the downside is near the $17,580 level.
The next major support is near the $17,500 zone. A downside break below the $17,500 support might call a drop towards $17,200 or the 100 hourly simple moving average. Any more losses might push the price towards the $17,000 zone in the near term.
Technical indicators:
Hourly MACD – The MACD is now losing pace in the bullish zone.
Hourly RSI (Relative Strength Index) – The RSI for BTC/USD is now above the 50 level.
Major Support Levels – $17,500, followed by $17,200.
Major Resistance Levels – $17,850, $18,000 and $18,500.
Featured Image from iStock