

Bitcoin price remained strong above the $16,700 level. BTC formed a base and started a fresh increase above the $17,000 resistance zone.
- Bitcoin found support near $16,700 and started a decent increase.
- The price is trading above $17,000 and the 100 hourly simple moving average.
- There was a break above a major bearish trend line with resistance near $16,875 on the hourly chart of the BTC/USD pair (data feed from Kraken).
- The pair is eyeing more gains above the $17,400 and $17,500 resistance levels.
Bitcoin Price Eyes Upside Break
Bitcoin price declined below the $16,800 support level. However, BTC bears failed to clear the $16,700 level. The price traded as low as $16,700 before there was a fresh increase.
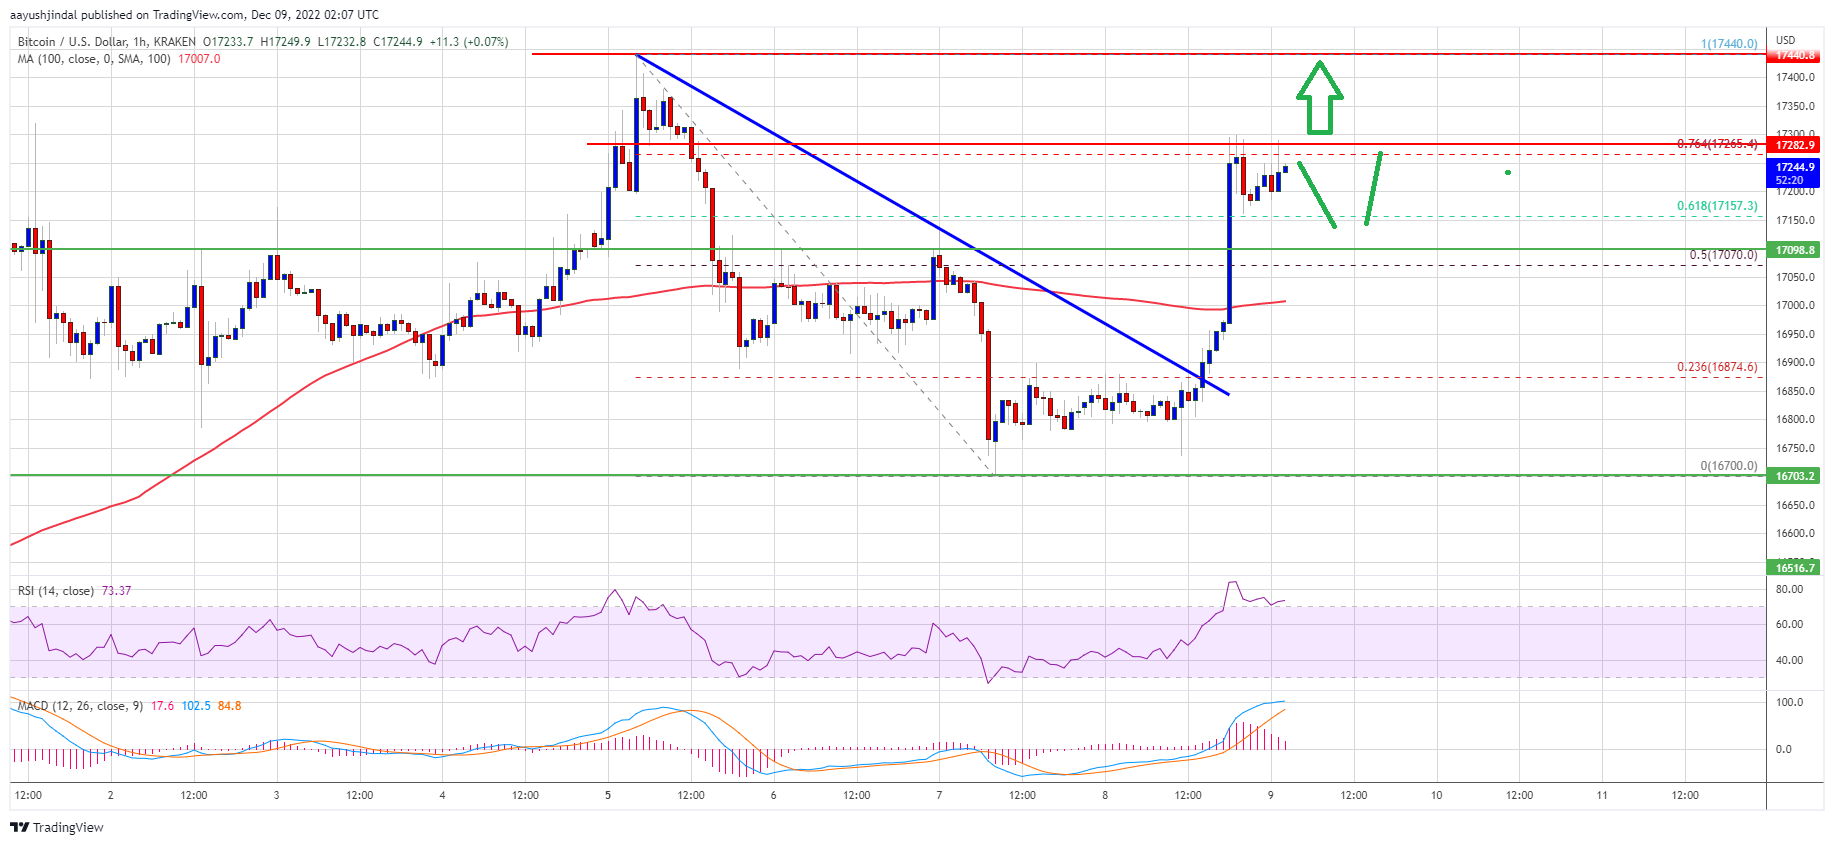
There was a decent increase above the $16,850 and $16,900 levels. The price cleared the 50% Fib retracement level of the downward move from the $17,440 swing high to $16,700 low. Besides, there was a break above a major bearish trend line with resistance near $16,875 on the hourly chart of the BTC/USD pair.
Bitcoin price is now trading above $17,000 and the 100 hourly simple moving average. It is also trading near the 76.4% Fib retracement level of the downward move from the $17,440 swing high to $16,700 low.
Source: BTCUSD on TradingView.com
On the upside, an immediate resistance is near the $17,280 level. The first major resistance is near the $17,450 zone, above which the price may perhaps start another steady increase. In the stated case, the price could rise towards the $18,000 resistance. The next major resistance is near $18,250, above which the price rise towards the $18,500 zone in the near term.
Dips Supported in BTC?
If bitcoin fails to clear the $17,280 resistance, there could be a fresh bearish reaction. An immediate support on the downside is near the $17,100 level.
The next major support is near the $17,000 zone and the 100 hourly simple moving average. A downside break below the $17,000 support might call a drop towards $16,700. Any more losses might push the price towards the $16,200 zone in the near term.
Technical indicators:
Hourly MACD – The MACD is now gaining pace in the bullish zone.
Hourly RSI (Relative Strength Index) – The RSI for BTC/USD is now in the overbought zone.
Major Support Levels – $17,000, followed by $16,700.
Major Resistance Levels – $17,280, $17,500 and $18,000.