

Ethereum extended its decline below the $1,240 support against the US Dollar. ETH remains at a risk of more losses below the $1,220 support in the near term.
- Ethereum remained in a bearish zone and traded below the $1,240 support.
- The price is now trading below $1,250 and the 100 hourly simple moving average.
- There is a key bearish trend line forming with resistance near $1,245 on the hourly chart of ETH/USD (data feed via Kraken).
- The pair remains at a risk of a downside break below the $1,220 support.
Ethereum Price Visits Key Support
Ethereum price failed to recover losses and extended its decline below the $1,250 level. ETH even traded below the $1,240 support level and the 100 hourly simple moving average, similar to bitcoin.
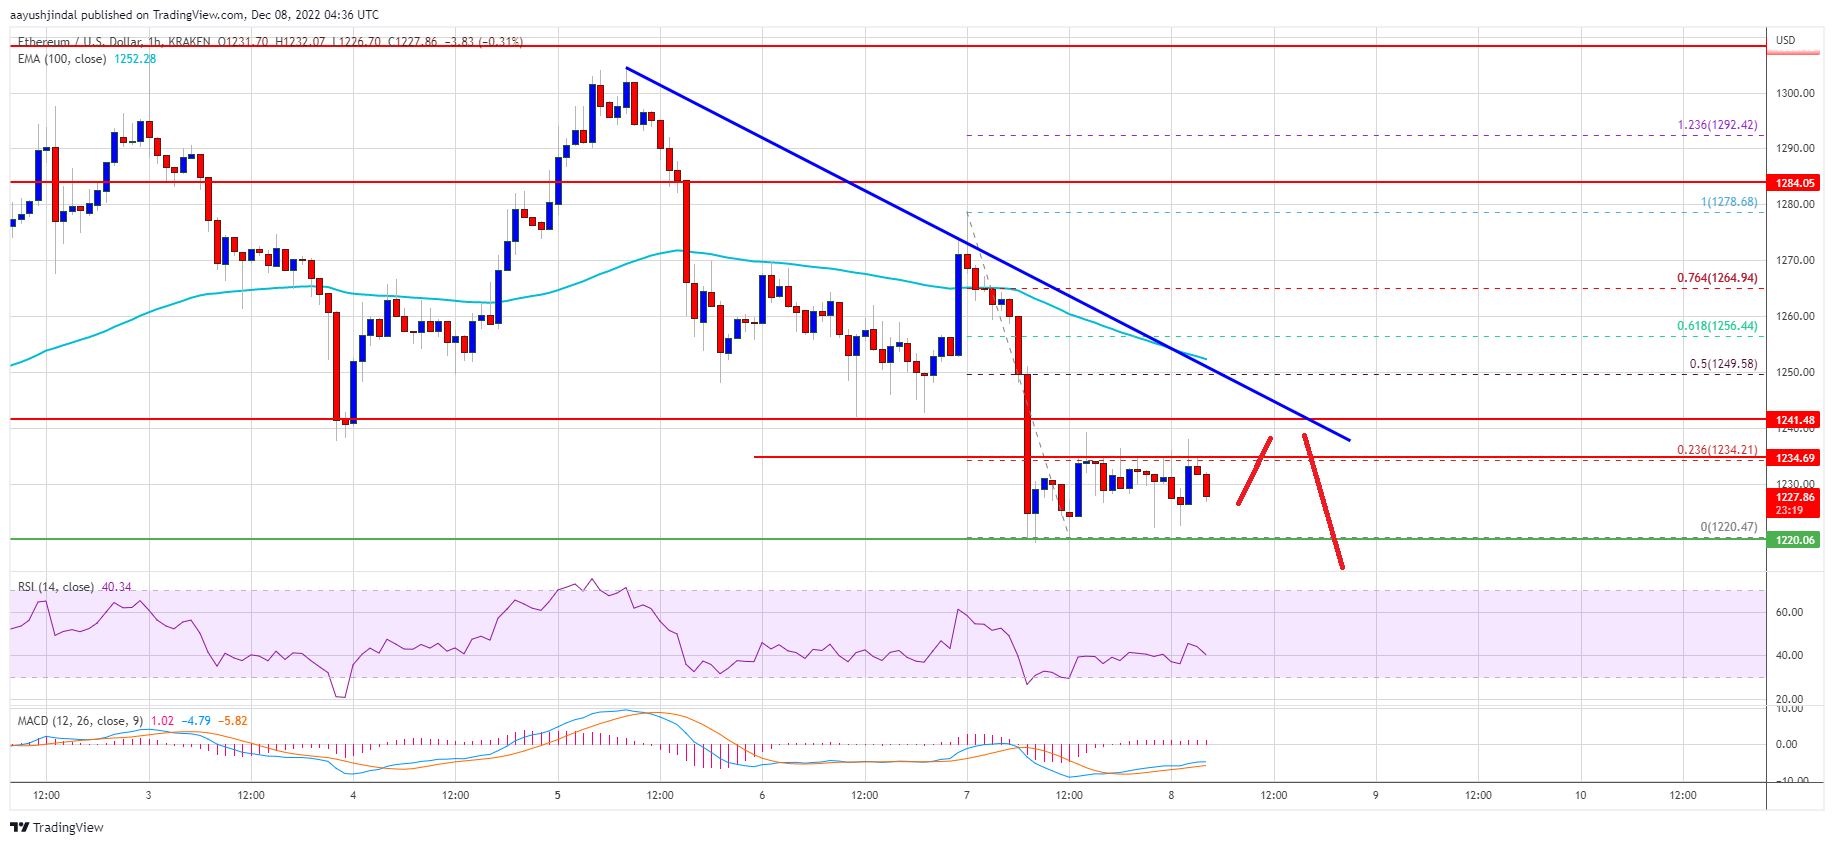
The price moved into a short-term bearish zone and even tested the $1,220 support. A low is formed near $1,220 and is currently consolidating losses. Ether price is now trading below $1,250 and the 100 hourly simple moving average.
There is also a key bearish trend line forming with resistance near $1,245 on the hourly chart of ETH/USD. An immediate resistance on the upside is near the $1,235 level. The 23.6% Fib retracement level of the recent drop from the $1,278 swing high to $1,220 low is also near $1,235.
The first major resistance is near the $1,245 level and the bearish trend line. Besides, the 50% Fib retracement level of the recent drop from the $1,278 swing high to $1,220 low and the 100 hourly simple moving average is near the $1,250 level.
Source: ETHUSD on TradingView.com
A close above the $1,250 resistance might start a fresh increase. The next major resistance is near the $1,280 level, above which ether price could gain bullish momentum for a move to $1,310. Any more gains might send the price towards the $1,350 resistance zone.
More Losses in ETH?
If ethereum fails to recover above the $1,250 resistance, it could continue to move down. An initial support on the downside is near the $1,220 level.
The next major support is near the $1,200 level. If there is a break and close below $1,200, the price could even drop towards the $1,165 support. Any more losses could lead the price towards the $1,075 support.
Technical Indicators
Hourly MACD – The MACD for ETH/USD is now gaining momentum in the bearish zone.
Hourly RSI – The RSI for ETH/USD is now below the 50 level.
Major Support Level – $1,220
Major Resistance Level – $1,250