

Ethereum started a decent recovery wave above $1,150 against the US Dollar. ETH is now approaching a major hurdle near $1,230 and $1,250.
- Ethereum started an upside correction above the $1,120 and $1,150 resistance levels.
- The price is now trading above $1,150 and the 100 hourly simple moving average.
- There is a key bullish trend line forming with support near $1,190 on the hourly chart of ETH/USD (data feed via Kraken).
- The pair could rise further towards $1,230, but the bears might take a strong stand.
Ethereum Price Faces Hurdle
Ethereum price formed a base above the $1,070 level and started a recovery wave, similar to bitcoin. ETH slowly moved higher and was able to clear the $1,150 resistance zone.
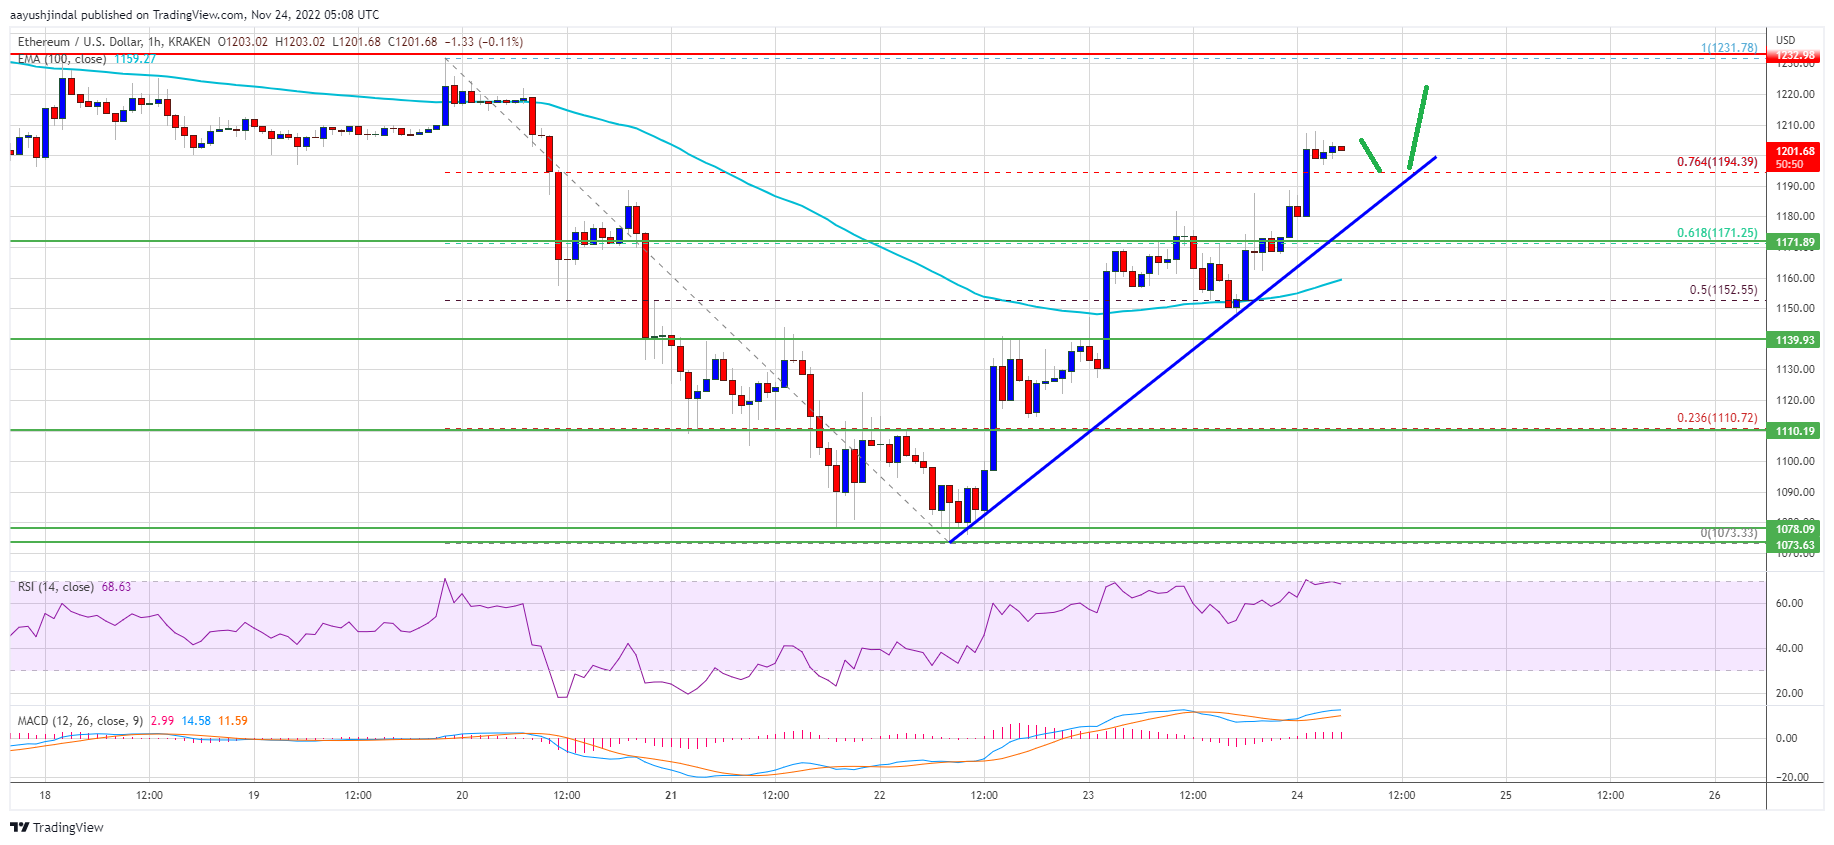
The bulls pushed the price above the 61.8% Fib retracement level of the downward move from the $1,231 swing high to $1,073 low. Ether price is now trading above $1,150 and the 100 hourly simple moving average. There is also a key bullish trend line forming with support near $1,190 on the hourly chart of ETH/USD.
The pair seems to be consolidating above the 76.4% Fib retracement level of the downward move from the $1,231 swing high to $1,073 low. An immediate resistance on the upside is near the $1,220 level.
Source: ETHUSD on TradingView.com
The next major resistance is near the $1,230 level and the $1,250 zone. To start a real recovery wave and gain bullish momentum, the price must settle above $1,250. A clear close above the $1,250 resistance could send the price towards the $1,320 resistance zone. Any more gains might open the doors for a test of the $1,400 resistance zone.
Fresh Decline in ETH?
If ethereum fails to climb above the $1,250 resistance, it could start another decline. An initial support on the downside is near the $1,190 level and the trend line.
The next major support is near the $1,150 level and the 100 hourly simple moving average, below which ether price may perhaps decline further. In the stated scenario, the price could decline towards the $1,100 support zone in the near term. Any more losses might call for a move towards the main $1,070 support.
Technical Indicators
Hourly MACD – The MACD for ETH/USD is now gaining momentum in the bullish zone.
Hourly RSI – The RSI for ETH/USD is now above the 50 level.
Major Support Level – $1,150
Major Resistance Level – $1,250