

Ethereum started another decline below the $1,180 support against the US Dollar. ETH is down over 8% and there is a risk of a move towards the $1,000 support.
- Ethereum started a major decline below the $1,180 and $1,170 support levels.
- The price is now trading below $1,150 and the 100 hourly simple moving average.
- There was a break below a key bullish trend line with support near $1,210 on the hourly chart of ETH/USD (data feed via Kraken).
- The pair could correct losses, but there is a risk of more downsides towards $1,000.
Ethereum Price Takes Hit
Ethereum price attempted an upside break above the $1,250 resistance, similar to bitcoin. ETH struggled to gain momentum and reacted to the downside below $1,200.
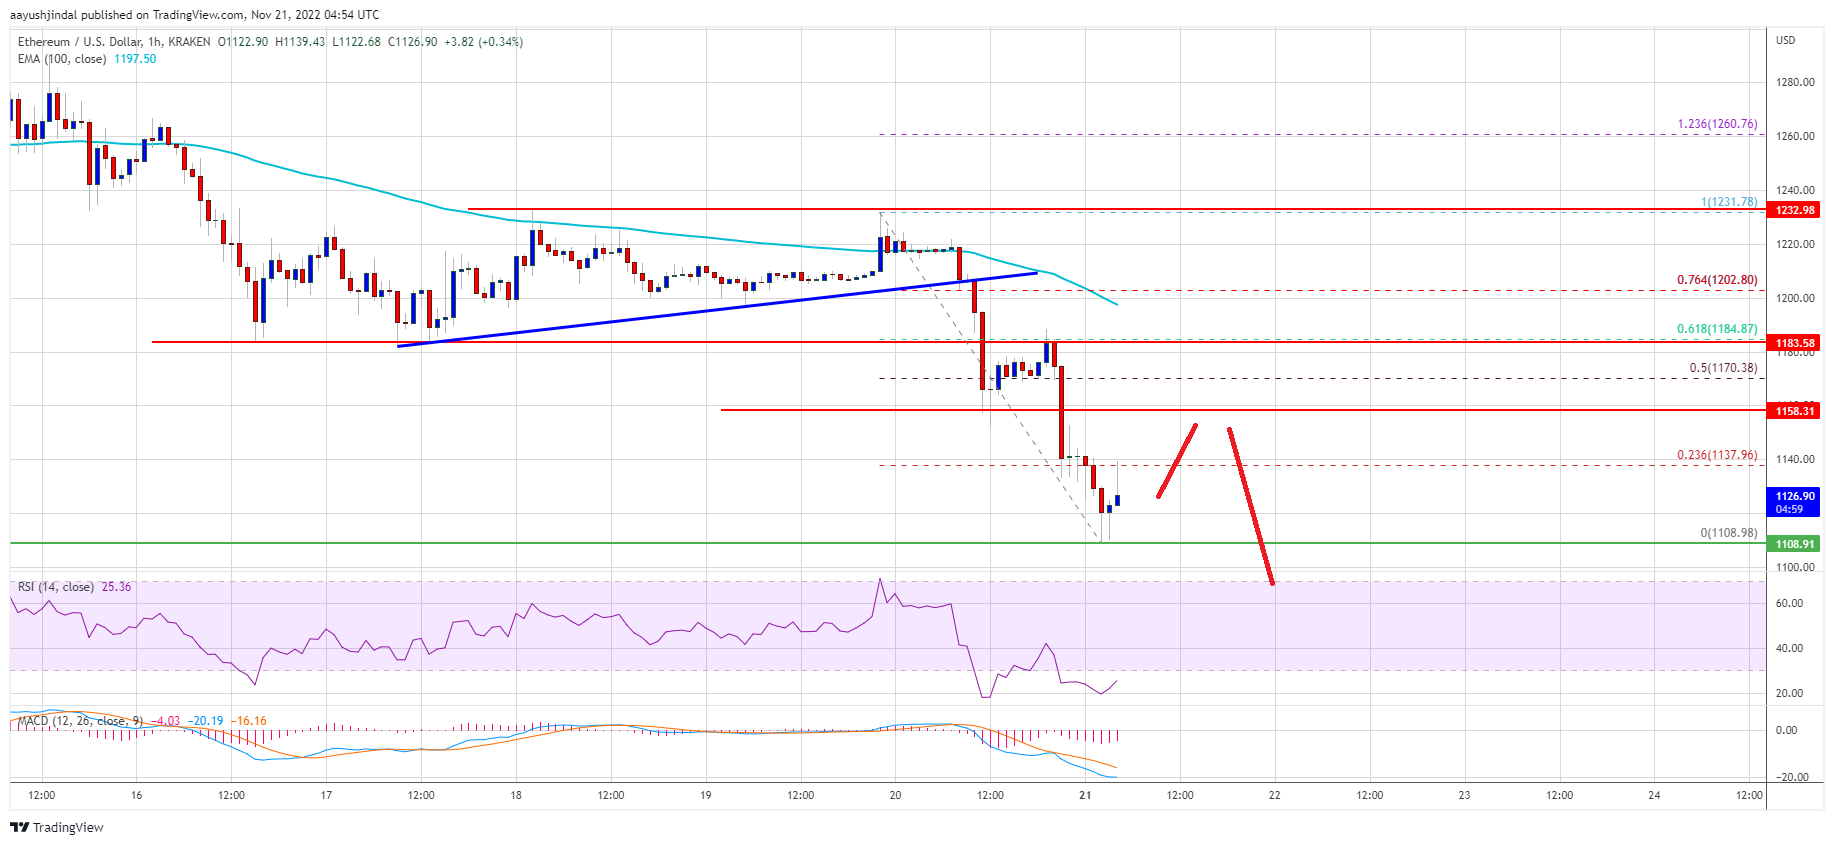
There was a break below the $1,180 and $1,170 support levels. Besides, there was a break below a key bullish trend line with support near $1,210 on the hourly chart of ETH/USD. The price gained bearish momentum and declined below the $1,150 level.
Finally, there was a spike below the $1,120 level and the price traded as low was $1,108. Ether price is now trading below $1,150 and the 100 hourly simple moving average.
An immediate resistance on the upside is near the $1,140 level. It is near the 23.6% Fib retracement level of the downward move from the $1,231 swing high to $1,108 low. The next major resistance is near the $1,170 level. The main resistance is now near $1,180.
Source: ETHUSD on TradingView.com
The 61.8% Fib retracement level of the downward move from the $1,231 swing high to $1,108 low is also near $1,180. A clear break above the $1,180 resistance could send the price towards the $1,250 resistance zone. If the bulls remain in action and the price settles above $1,250, the price could start a steady increase towards the $1,300 level.
More Losses in ETH?
If ethereum fails to climb above the $1,180 resistance, it could continue to move down. An initial support on the downside is near the $1,110 level.
The next major support is near the $1,080 level, below which ether price may perhaps gain bearish momentum. In the stated scenario, the price could drop towards the $1,000 support zone in the near term.
Technical Indicators
Hourly MACD – The MACD for ETH/USD is now losing momentum in the bearish zone.
Hourly RSI – The RSI for ETH/USD is now in the oversold zone.
Major Support Level – $1,100
Major Resistance Level – $1,180