

MATIC price started a major decline from the $1.00 resistance zone. Polygon bears are in control and might aim more losses towards $0.70 in the near term.
- MATIC price started a major decline from well above $0.95 against the US dollar.
- The price is trading below $0.85 and the 100 simple moving average (4-hours).
- There is a major bearish trend line forming with resistance at $0.821 on the 4-hours chart of the MATIC/USD pair (data source from Kraken).
- The pair could continue to decline towards the $0.70 support zone in the near term.
Polygon’s MATIC Price Dives
Earlier this month, polygon’s price made an attempt to gain pace above the $1.0 resistance zone. However, MATIC struggled to gain bullish momentum for a move above $1.0.
A high was formed near $0.972 before the price started a fresh decline. There was a steady decline, similar to bitcoin and ethereum. The bears were able to push the price below the $0.90 support zone and the 100 simple moving average (4-hours).
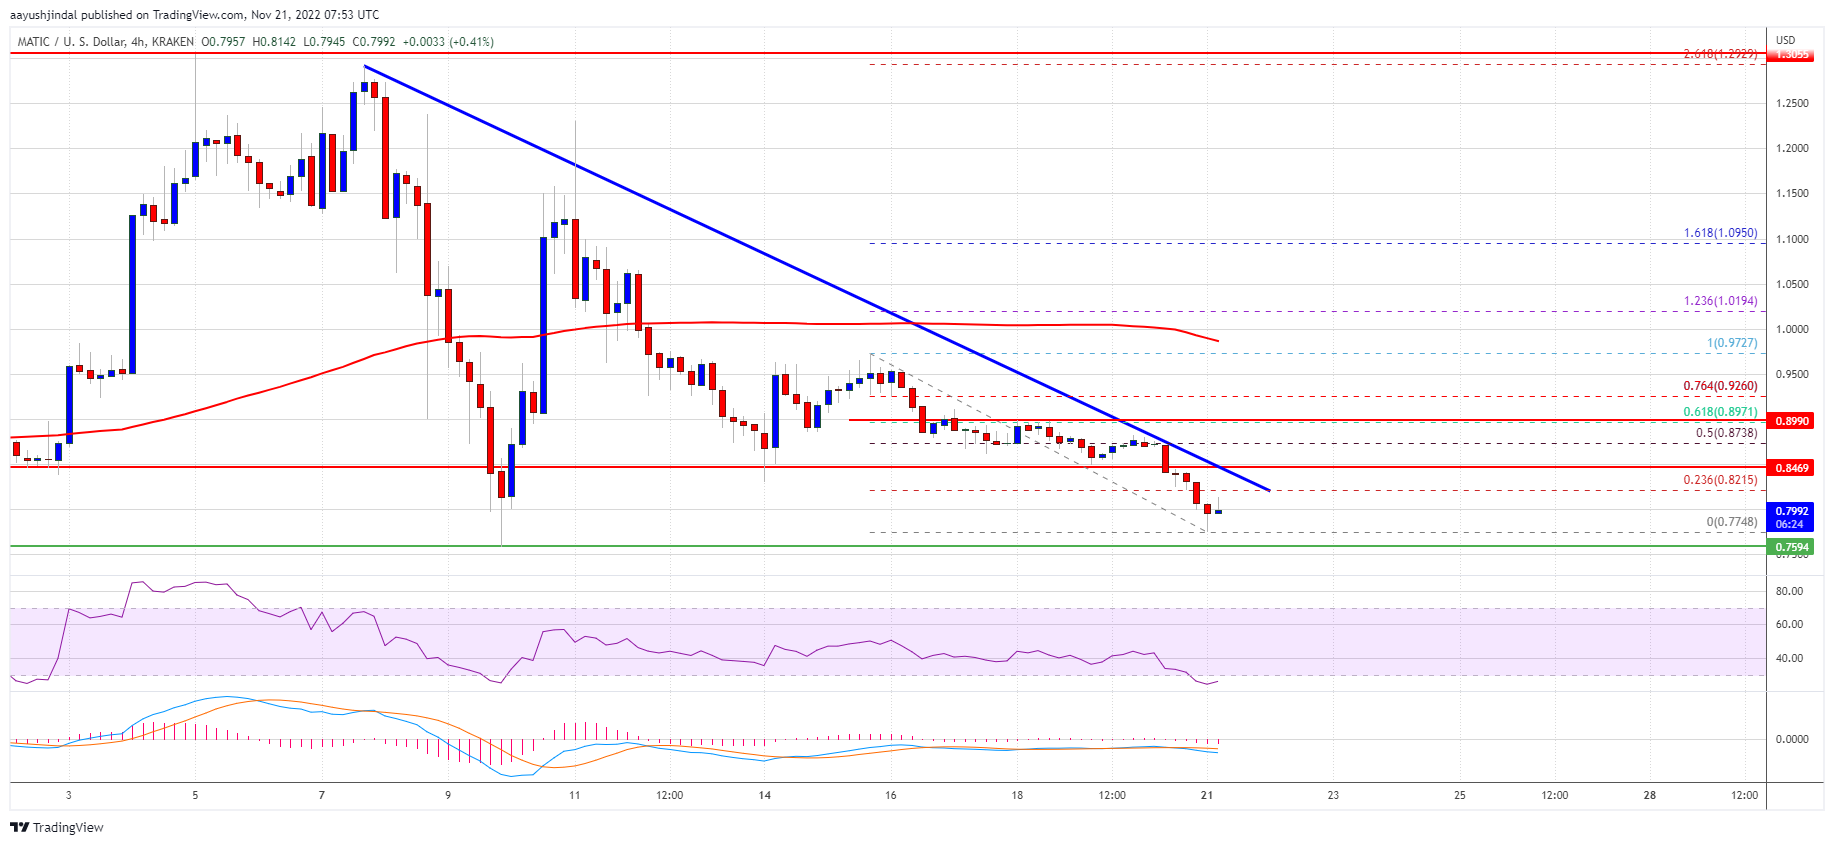
Finally, the price broke a major support at $0.840 and traded as low as $0.7748. It is now consolidating losses near the $0.800 level. On the upside, an immediate resistance is near the $0.8210 zone.
There is also a major bearish trend line forming with resistance at $0.821 on the 4-hours chart of the MATIC/USD pair. The trend line is near the 23.6% Fib retracement level of the recent decline from the $0.972 swing high to $0.7748 low.
The first major resistance is forming near the $0.875 zone. It is near the 50% Fib retracement level of the recent decline from the $0.972 swing high to $0.7748 low.
Source: MATICUSD on TradingView.com
The main resistance is now forming near the $1.00 level. If there is an upside break above the $0.90 and $1.00 resistance levels, the price could start another strong increase. In the stated case, the price could rise steadily towards the $1.20 level.
More Losses?
If MATIC price rise above the $0.82 and $0.87 resistance levels, it could continue to move down. An immediate support on the downside is near the $0.780 level.
The main support is near the $0.750 level. A downside break below the $0.750 level could open the doors for a fresh decline towards $0.70. The next major support is near the $0.665 level.
Technical Indicators
4-hours MACD – The MACD for MATIC/USD is slowly losing momentum in the bearish zone.
4-hours RSI (Relative Strength Index) – The RSI for MATIC/USD is now below the 50 level.
Major Support Levels – $0.78 and $0.70.
Major Resistance Levels – $0.821, $0.875 and $1.00.