

Ethereum started a recovery wave above the $1,210 level against the US Dollar. ETH must clear $1,260 and the 100 hourly SMA to start a decent recovery wave.
- Ethereum started a recovery wave above the $1,200 and $1,220 levels.
- The price is now trading below $1,280 and the 100 hourly simple moving average.
- There is a key bearish trend line forming with resistance near $1,260 on the hourly chart of ETH/USD (data feed via Kraken).
- The pair is now struggling to clear the $1,260 resistance and the 100 hourly simple moving average.
Ethereum Price Near Key Juncture
Ethereum reacted to the downside after it failed to clear $1,300, similar to bitcoin. ETH traded below the $1,220 support level and settled below the 100 hourly simple moving average.
It even spiked below $1,200 and traded as low as $1,170. Recently, there was an upside correction above the $1,200 and $1,220 levels. Ether price climbed above the 23.6% Fib retracement level of the recent decline from the $1,348 swing high to $1,170 low.
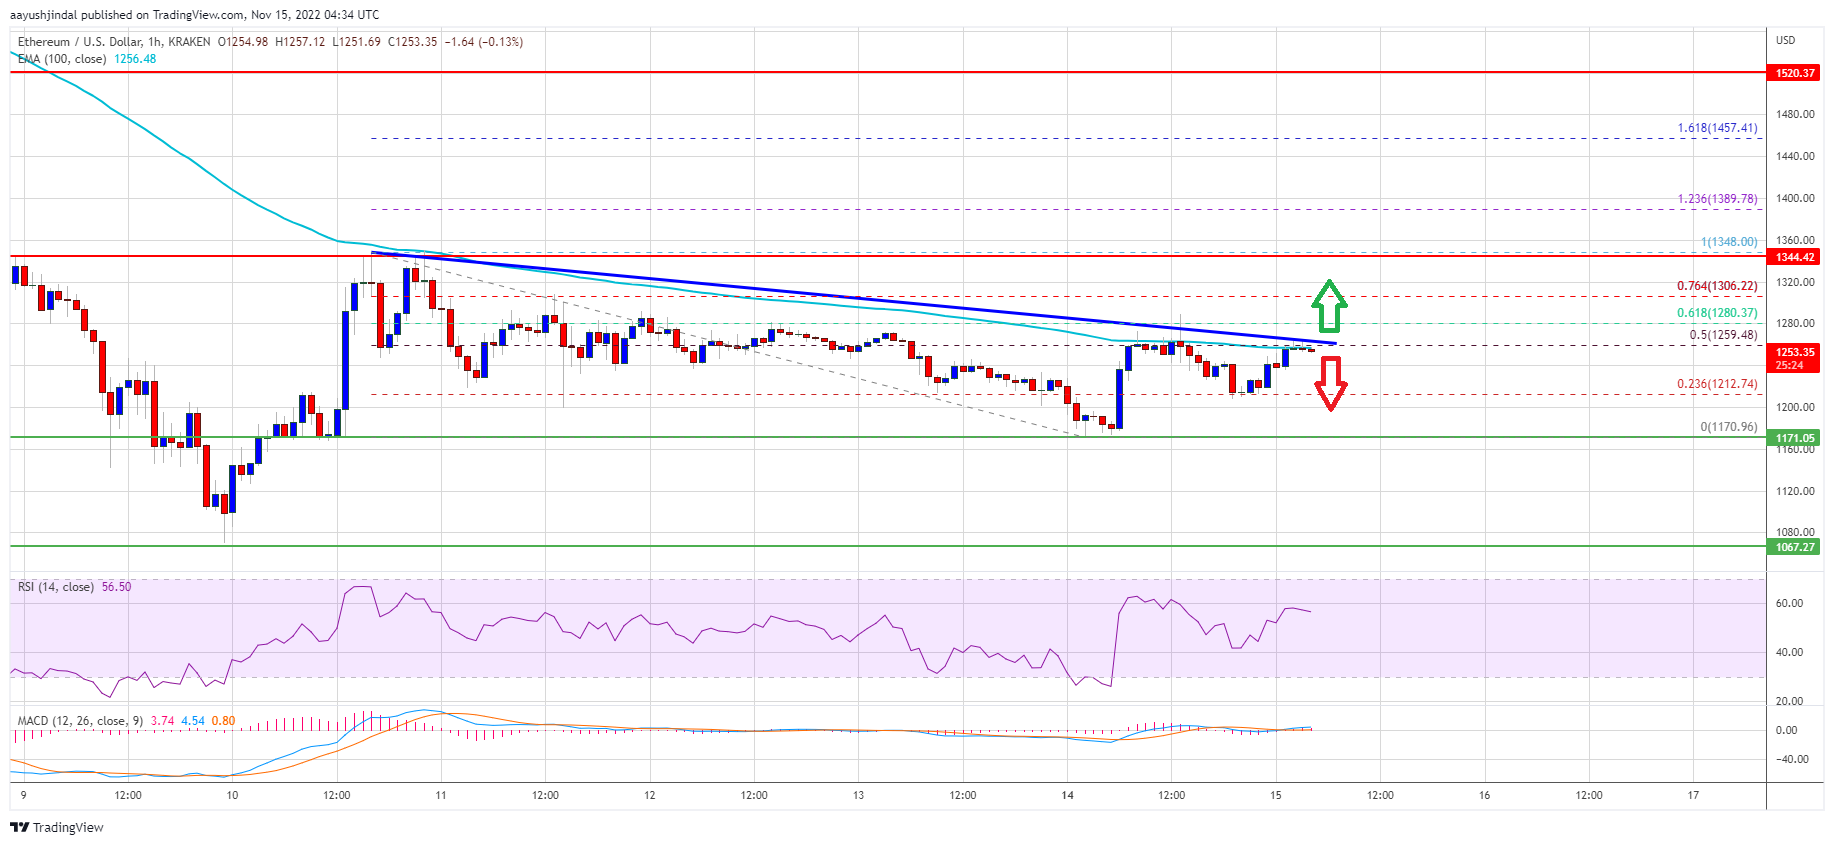
Ether price is now trading below $1,280 and the 100 hourly simple moving average. An immediate resistance on the upside is near the $1,260 level. There is also a key bearish trend line forming with resistance near $1,260 on the hourly chart of ETH/USD.
The trend line is near the 50% Fib retracement level of the recent decline from the $1,348 swing high to $1,170 low. The next major resistance is near the $1,300 level. A clear break above the $1,300 resistance could set the pace for a decent increase.
Source: ETHUSD on TradingView.com
In the stated case, the price could rise to the $1,350 level. Any more gains might send the price toward the $1,400 resistance zone.
Fresh Decline in ETH?
If ethereum fails to climb above the $1,300 resistance, it could start another decline. An initial support on the downside is near the $1,210 level.
The next major support is near the $1,170 level, below which ether price may perhaps accelerate lower. In the stated scenario, the price could decline towards the $1,100 support zone in the near term.
Technical Indicators
Hourly MACD – The MACD for ETH/USD is now losing momentum in the bullish zone.
Hourly RSI – The RSI for ETH/USD is now above the 50 level.
Major Support Level – $1,170
Major Resistance Level – $1,300