

XRP price started a major decline from the $0.50 resistance against the US Dollar. The recent collapse of FTX and FTT sparked a sharp move towards the $0.32 support.
- Ripple is down over 15% and there was a drop below the $0.40 support against the US dollar.
- The price is trading well below $0.4000 and the 100-day simple moving average.
- There was a break below a major contracting triangle with support at $0.455 on the daily chart of the XRP/USD pair (data source from Kraken).
- The pair could start a recovery wave if the bulls remain active near the $0.32 support.
Ripple’s XRP Price Tests Key Support
In the past 3-4 days, the crypto market saw a major decline. Bitcoin, ethereum, ftt, bnb, and sol saw a substantial decline. Ripple’s XRP price also faced the heat and declined heavily from the $0.50 resistance zone.
There was a clear move below the $0.450 and $0.40 support levels. Besides, there was a break below a major contracting triangle with support at $0.455 on the daily chart of the XRP/USD pair. The pair dropped below the $0.350 support and tested a crucial support at $0.320.
A low is formed near the $0.320 level and the price is now consolidating losses. XRP is now trading well below $0.4000 and the 100-day simple moving average.
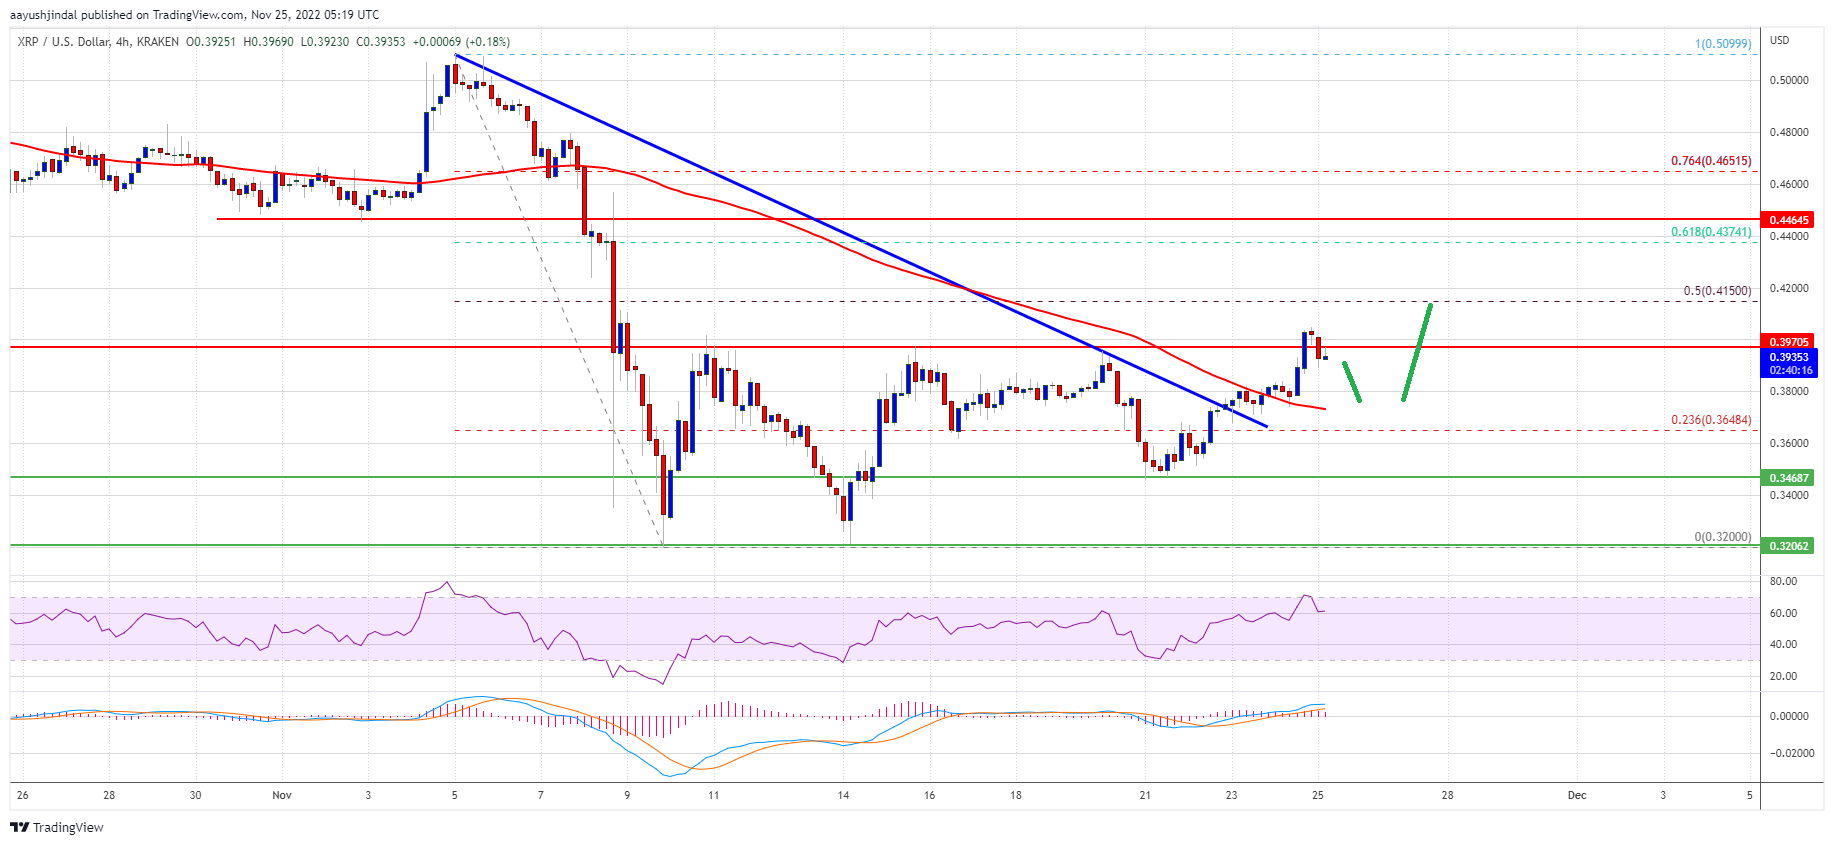
An immediate resistance is near the $0.3650 level. It is close to the 23.6% Fib retracement level of the downward move from the $0.5099 swing high to $0.3200 low. The first major resistance is seen near the $0.380 level, above which the price might recover towards the $0.415 level and the 100-day simple moving average.
Source: XRPUSD on TradingView.com
The 50% Fib retracement level of the downward move from the $0.5099 swing high to $0.3200 low is also near $0.415. A clear break above the $0.415 resistance could open the doors for a sharp increase towards the $0.5000 resistance. The next major resistance above the $0.5000 level could be near the $0.5200 level.
Dips Supported?
If ripple fails to clear the $0.380 resistance, it could start a fresh decline. An initial support on the downside is near the $0.3400 level.
The main support could be near the $0.3200 level or the $0.3000 zone. If the price fails to stay above $0.3000, it could start another major decline.
Technical Indicators
Daily MACD – The MACD for XRP/USD is now losing momentum in the bearish zone.
Daily RSI (Relative Strength Index) – The RSI for XRP/USD is now below the 50 level.
Major Support Levels – $0.3400, $0.3200 and $0.3000.
Major Resistance Levels – $0.3650, $0.3800 and $0.4150.