

Bitcoin price declined over 10% and even spiked below $18,000. BTC remains at a risk of more losses, as the FTX faces more heat.
- Bitcoin started failed to recover ground and declined over 10%.
- The price is trading below $19,500 and the 100 hourly simple moving average.
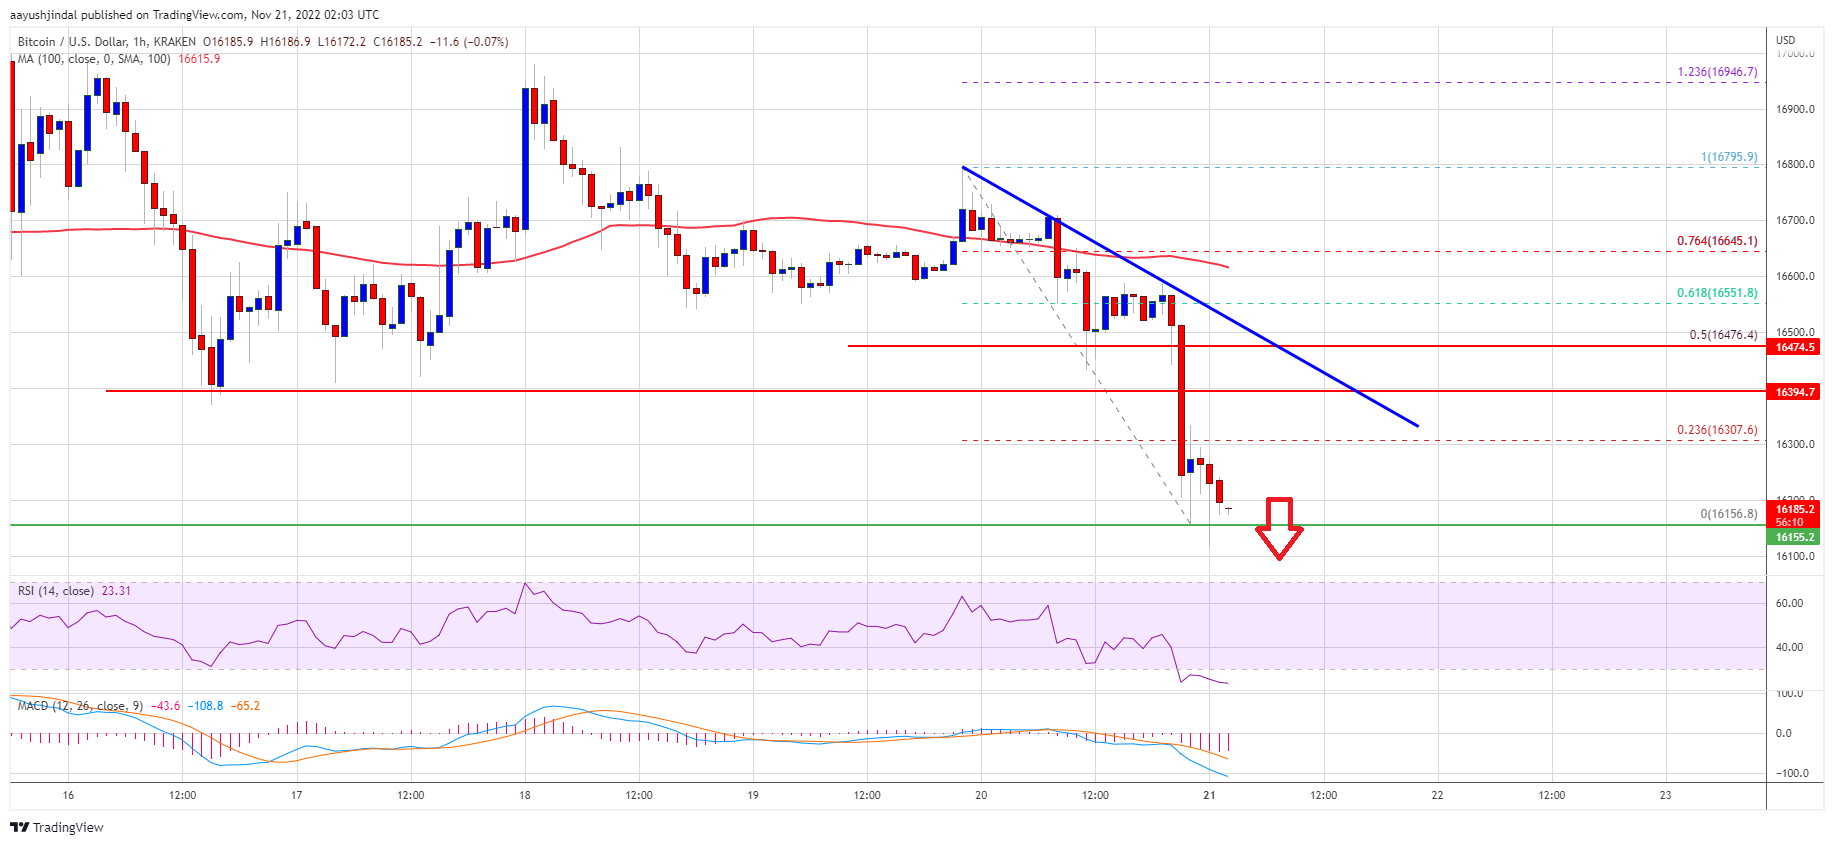
- There is a connecting bearish trend line forming with resistance near $18,380 on the hourly chart of the BTC/USD pair (data feed from Kraken).
- The pair could continue to move down towards the $17,500 and $16,800 support levels.
Bitcoin Price Nosedives
Bitcoin price started a major decline after it settled below the $20,000 support zone. FTX’s problems escalated the issues and the crypto market faced a strong selling pressure. BTC declined below the $19,500 and $19,000 levels.
The bears were able to push the price below the key $18,500 support. The price even dives below the $18,000 level and settled well below the 100 hourly simple moving average. A low was formed near $17,276 and the price recently corrected higher.
There was a move above the $18,000 level. Bitcoin price climbed above the 23.6% Fib retracement level of the recent decline from the $20,670 swing high to $17,276 low.
The price is now trading below $19,000 and the 100 hourly simple moving average. On the upside, an immediate resistance is near the $18,400 level. There is also a connecting bearish trend line forming with resistance near $18,380 on the hourly chart of the BTC/USD pair.
Source: BTCUSD on TradingView.com
The first major resistance is near the $19,000 level. It is near the 50% Fib retracement level of the recent decline from the $20,670 swing high to $17,276 low. A clear move above the trend line resistance and $19,000 might start a fresh increase towards $20,000. The next major resistance is near $20,500, above which the price could test the $21,000 zone.
More Losses in BTC?
If bitcoin fails to start a recovery wave above the $19,000 resistance zone, it could resume its decline. An immediate support on the downside is near the $18,000 level.
The next major support is near the $17,250 zone. A clear move below the $17,250 support might push the price further lower. In this case, the price may perhaps decline towards the $16,800 level.
Technical indicators:
Hourly MACD – The MACD is now gaining pace in the bearish zone.
Hourly RSI (Relative Strength Index) – The RSI for BTC/USD is now below the 50 level.
Major Support Levels – $18,000, followed by $17,250.
Major Resistance Levels – $18,400, $19,000 and $20,000.