

Bitcoin price corrected lower below the $19,500 level against the US Dollar. BTC remains in a key range and trading above the $19,000 support zone.
- Bitcoin failed to gain strength above $19,600 and corrected gains.
- The price is trading near $19,250 and the 100 hourly simple moving average.
- There was a break below a key bullish trend line with support near $19,400 on the hourly chart of the BTC/USD pair (data feed from Kraken).
- The pair could attempt a fresh increase unless there is a clear move below the $19,000 support.
Bitcoin Price Remains Supported
Bitcoin price made an attempt to gain pace above the $19,500 resistance zone. BTC even spiked above the $19,600 level, but there was no follow through move.
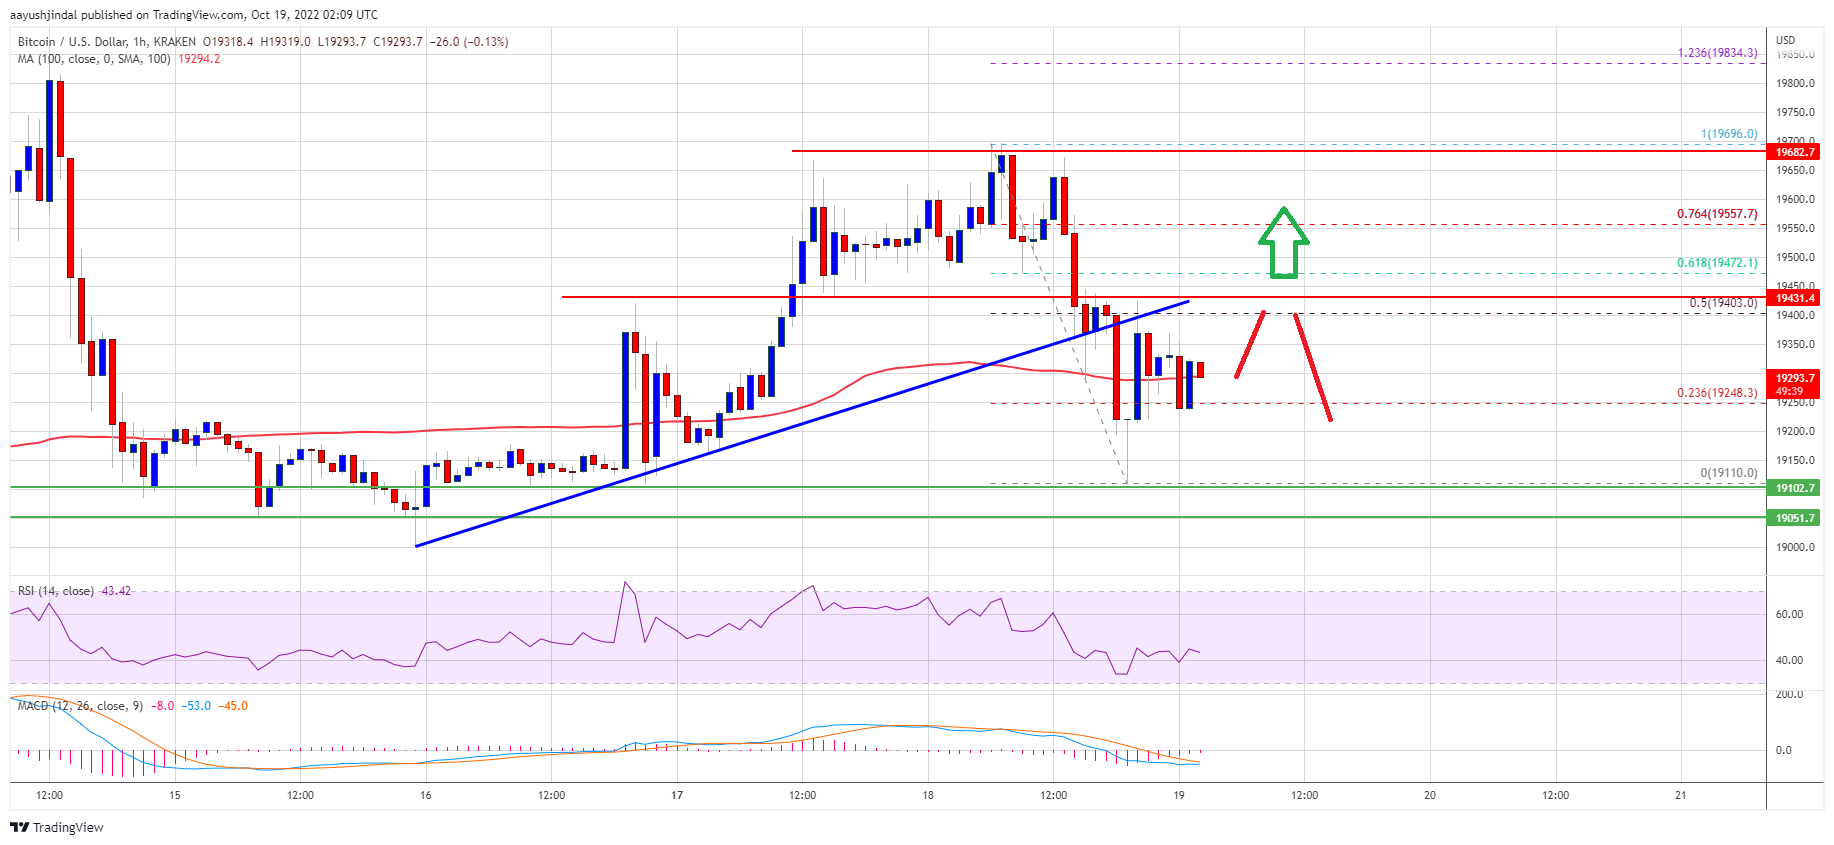
The price formed a high near $19,696 and started a downside correction. There was a move below the $19,500 and $19,400 levels. Besides, there was a break below a key bullish trend line with support near $19,400 on the hourly chart of the BTC/USD pair.
Bitcoin price traded as low as $19,110 and is currently trading in a range. It is trading near $19,250 and the 100 hourly simple moving average. There was a break above the 23.6% Fib retracement level of the recent decline from the $19,696 swing high to $19,110 low.
On the upside, an immediate resistance is near the $19,400 level. It is close to the 50% Fib retracement level of the recent decline from the $19,696 swing high to $19,110 low.
Source: BTCUSD on TradingView.com
The first major resistance sits near the $19,680 level. A clear move above the $19,680 resistance might start a decent increase. In the stated case, the price may perhaps test the $20,000 resistance. Any more gains might start a steady increase towards the $21,200 resistance zone.
Downside Break in BTC?
If bitcoin fails to rise above the $19,400 resistance zone, it could continue to move down. An immediate support on the downside is near the $19,100 zone.
The next major support is near the $19,000 zone. A downside break and close below the $19,000 support zone might start a major decline. In the stated case, the price could decline towards the $18,500 support zone.
Technical indicators:
Hourly MACD – The MACD is now losing pace in the bearish zone.
Hourly RSI (Relative Strength Index) – The RSI for BTC/USD is now below the 50 level.
Major Support Levels – $19,100, followed by $19,000.
Major Resistance Levels – $19,400, $19,680 and $20,000.