

Ethereum spiked lower after the US CPI release against the US Dollar. ETH dived to $1,200 before it started a sharp increase and surpassed $1,300.
- Ethereum trimmed all losses and climbed back above the $1,300 resistance zone.
- The price is now trading above $1,300 and the 100 hourly simple moving average.
- There was a break above a major bearish trend line with resistance near $1,290 on the hourly chart of ETH/USD (data feed via Kraken).
- The pair seems to be eyeing a steady increase above the $1,350 resistance zone.
Ethereum Price Jumps Over 5%
Ethereum faced a sharp decline after the US CPI data was released, similar to bitcoin price. ETH dropped below the $1,250 support level. It even spiked below the $1,200 level before the bulls emerged.
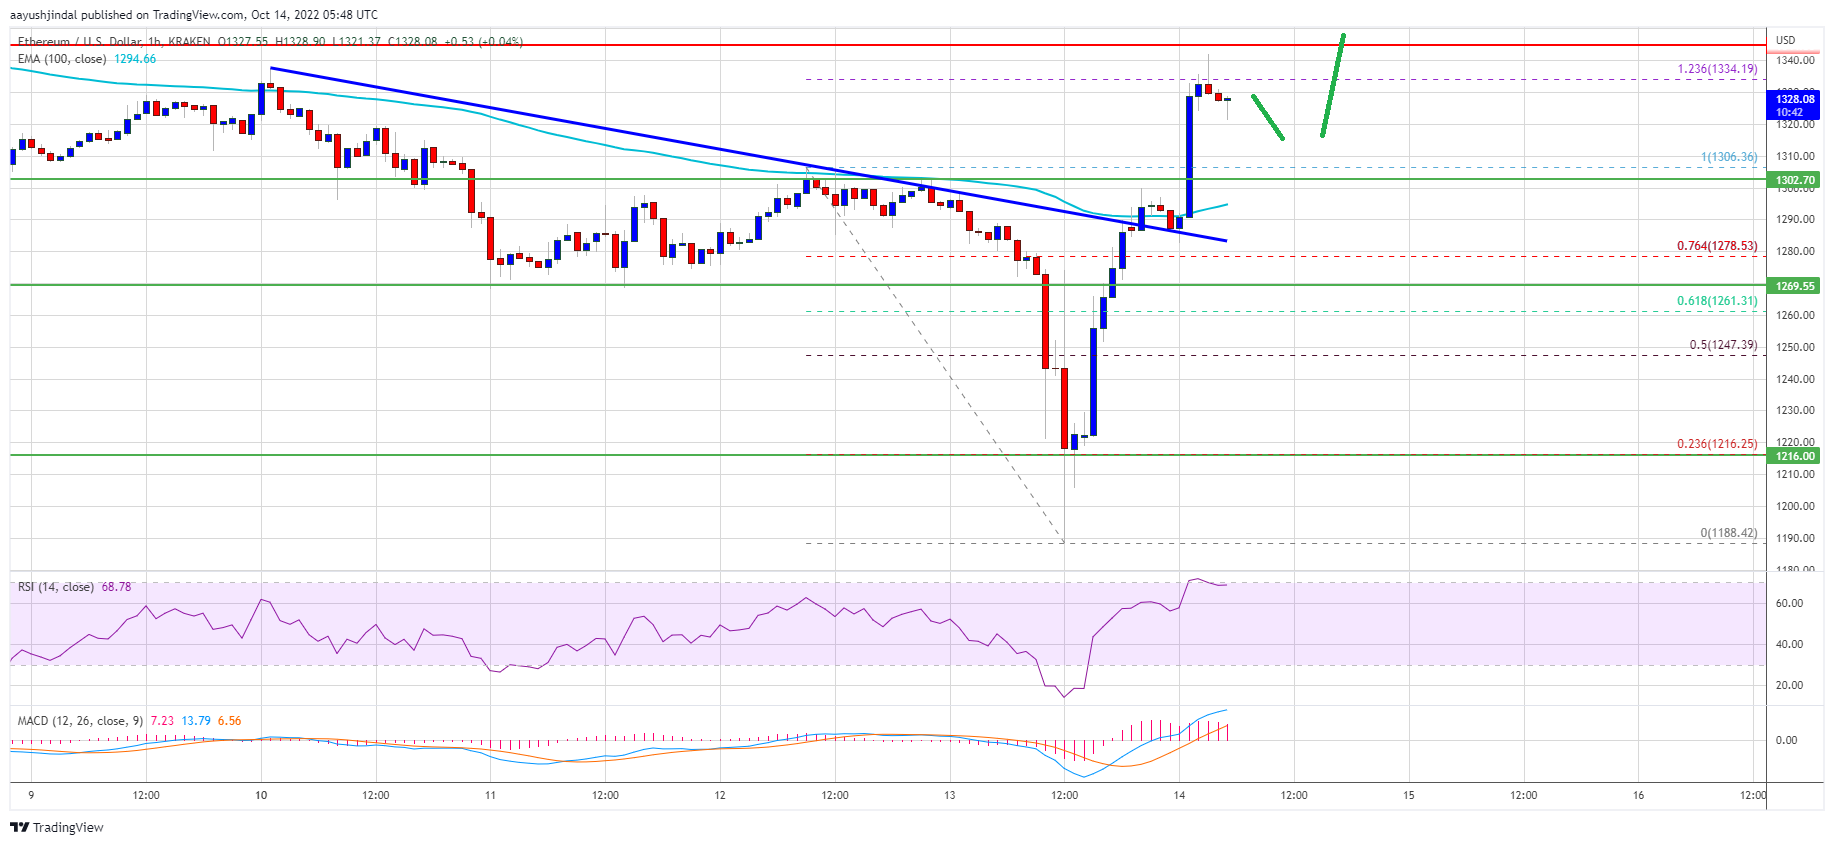
A low was formed near $1,188 and the price started a strong increase. There was over 5% rally above the $1,250 resistance zone. Ether price broke the 61.8% Fib retracement level of the downward move from the $1,306 swing high to $1,188 low.
Besides, there was a break above a major bearish trend line with resistance near $1,290 on the hourly chart of ETH/USD. The pair is now trading above $1,300 and the 100 hourly simple moving average.
An immediate resistance on the upside is near the $1,335 level. It is near the 1.236 Fib extension level of the downward move from the $1,306 swing high to $1,188 low. The first major resistance is near the $1,350 level. A clear upside break above the $1,350 resistance zone could open the doors for more gains.
Source: ETHUSD on TradingView.com
In the stated case, the price may perhaps rise towards the $1,400 resistance. Any more gains might send the price towards the $1,500 resistance.
Fresh Decline in ETH?
If ethereum fails to climb above the $1,335 resistance, it could start a downside correction. An initial support on the downside is near the $1,310 level.
The next major support is near the $1,290 level and the 100 hourly simple moving average. A downside break below the $1,290 might start a fresh decline to $1,250. Any more losses may perhaps open the gates for a move towards the $1,200 support.
Technical Indicators
Hourly MACD – The MACD for ETH/USD is now gaining momentum in the bullish zone.
Hourly RSI – The RSI for ETH/USD is now in the overbought zone.
Major Support Level – $1,290
Major Resistance Level – $1,335