

Bitcoin price traded to a new weekly low before reversing losses against the US Dollar. BTC broke $19,500 and might rise further towards $20,500.
- Bitcoin is up nearly 5% and there was a clear move above the $19,500 resistance zone.
- The price is trading below above $19,500 and the 100 hourly simple moving average.
- There was a break above a major bearish trend line with resistance near $19,150 on the hourly chart of the BTC/USD pair (data feed from Kraken).
- The pair is showing bullish signs and might extend gains above $20,000.
Bitcoin Price Starts Fresh Rally
Bitcoin price extended losses below the $19,000 support zone. Yesterday, the US CPI data was released, which posted an increase of 8.2%. It pushed BTC price below the $18,500 support zone.
The bears gained strength and the price dived to the $18,200 support zone. However, the bears failed to push the price further lower. A low was formed near $18,142 and there was a strong bullish reaction. The price gained bullish momentum and climbed above the $19,000 level.
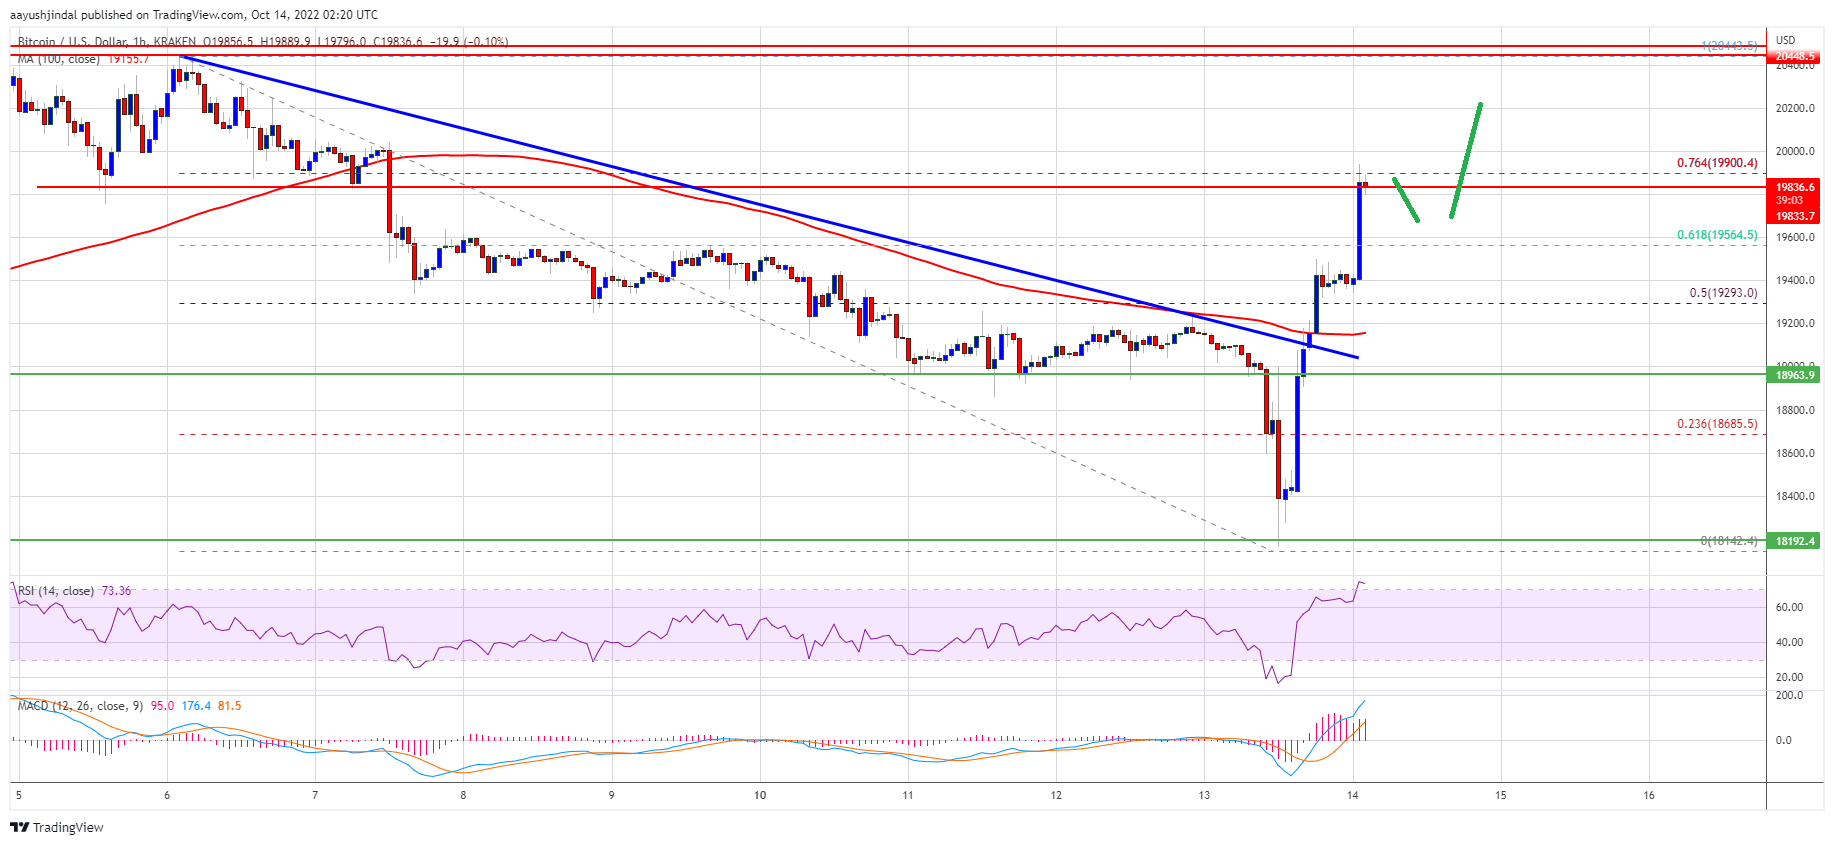
Bitcoin price cleared the 50% Fib retracement level of the downward move from the $20,443 swing high to $18,142 low. Besides, there was a break above a major bearish trend line with resistance near $19,150 on the hourly chart of the BTC/USD pair.
The price is now trading below above $19,500 and the 100 hourly simple moving average. It is trading near the 76.4% Fib retracement level of the downward move from the $20,443 swing high to $18,142 low.
Source: BTCUSD on TradingView.com
On the upside, an immediate resistance is near the $20,000 level. A clear move above the $20,000 resistance might pump the price further higher. The next major resistance is near the $20,450 level. Any more gains might start a steady increase towards the $21,200 resistance zone.
Dips Supported in BTC?
If bitcoin fails to rise above the $20,000 resistance zone, it could start a downside correction. An immediate support on the downside is near the $19,500 zone.
The next major support is near the $19,200 zone and the 100 hourly SMA. A downside break below the $19,200 support zone might increase selling pressure. In the stated case, the price could decline towards the $18,500 support zone.
Technical indicators:
Hourly MACD – The MACD is now gaining pace in the bullish zone.
Hourly RSI (Relative Strength Index) – The RSI for BTC/USD is now in the overbought zone.
Major Support Levels – $19,500, followed by $19,200.
Major Resistance Levels – $20,000, $20,450 and $21,200.