

Bitcoin started an upside correction above $19,000 against the US Dollar. BTC is now facing a strong resistance near the $19,350 and $19,500 levels.
- Bitcoin is attempting an upside correction above the $19,000 level.
- The price is still trading below $19,500 and the 100 hourly simple moving average.
- There is a major bearish trend line forming with resistance near $19,420 on the hourly chart of the BTC/USD pair (data feed from Kraken).
- The pair must clear the trend line and the 100 hourly SMA to continue higher towards $20,500.
Bitcoin Price Faces Hurdles
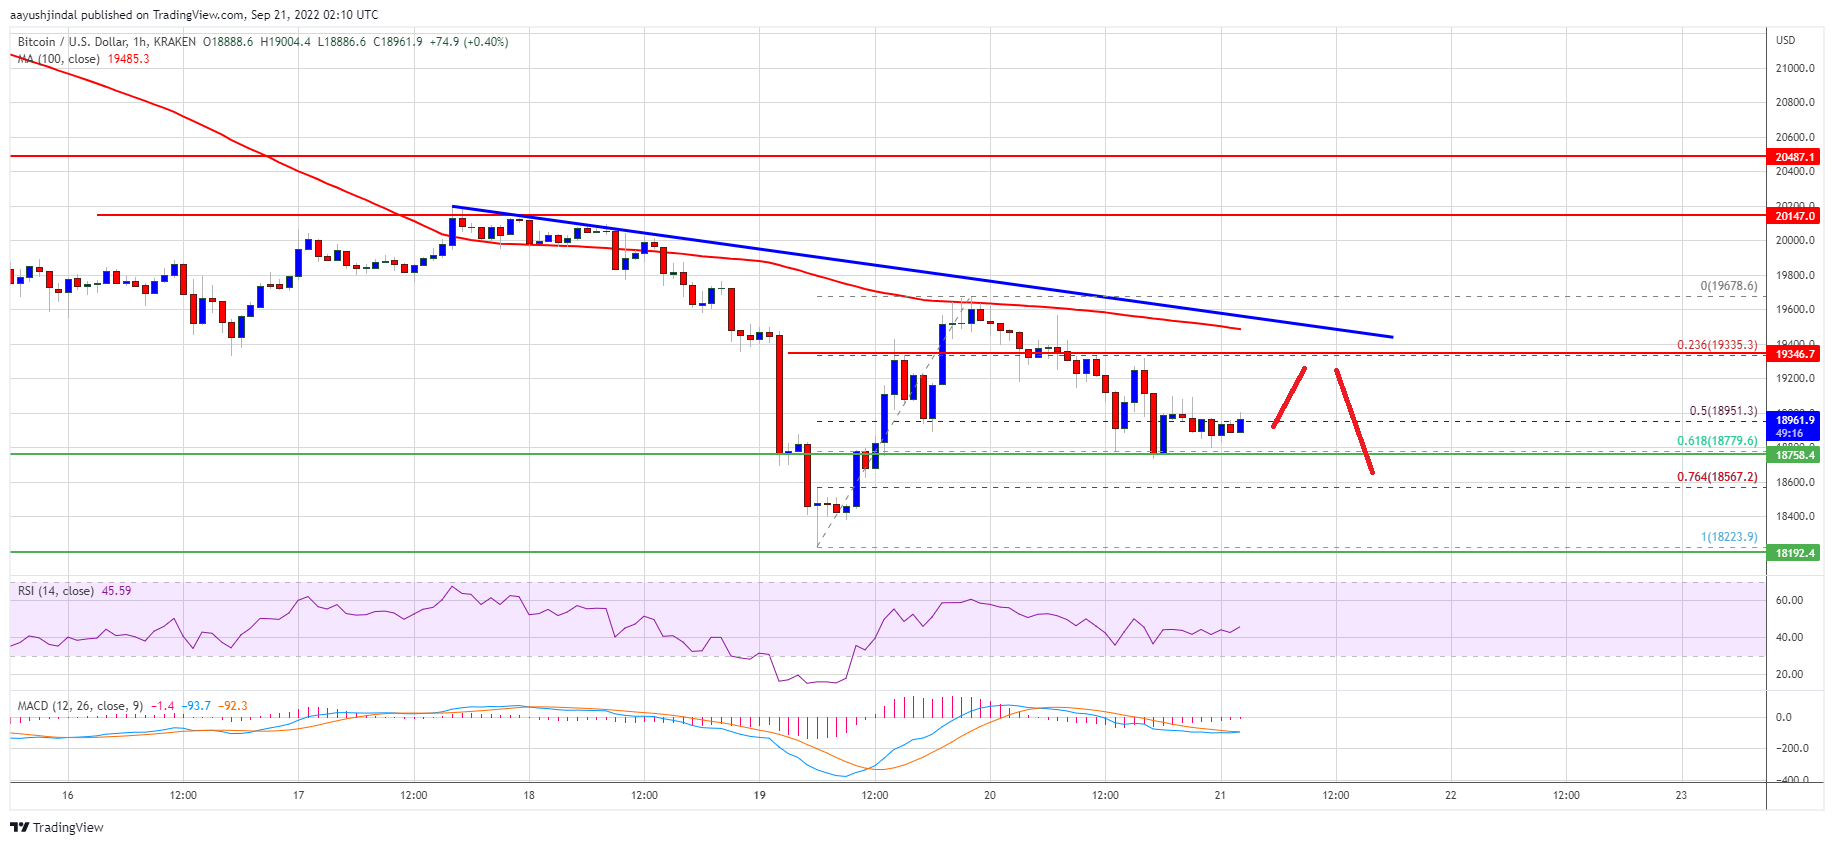
Bitcoin price started a short-term upside correction from the $18,223 low. BTC was able to climb above the $18,800 and $19,000 levels. It even cleared the $19,350 resistance zone.
However, the price faced a strong resistance near the $19,650 level and the 100 hourly simple moving average. A high was formed near $19,678 and the price started a fresh decline. There was a move below the $19,500 and $19,400 levels.
Bitcoin price traded below the 50% Fib retracement level of the upward move from the $18,223 swing low to $19,678 high. The bulls are now protecting the $18,800 support zone.
The 61.8% Fib retracement level of the upward move from the $18,223 swing low to $19,678 high is acting as a support. On the upside, an immediate resistance is near the $19,200 level. The next major resistance sits near the $19,350 level.
Source: BTCUSD on TradingView.com
There is also a major bearish trend line forming with resistance near $19,420 on the hourly chart of the BTC/USD pair. A clear move above the trend line, the 100 hourly simple moving average, and $19,500 could open the doors for a move towards the $20,000 level. Any more gains might send the price towards the $20,500 resistance zone.
Fresh Decline in BTC?
If bitcoin fails to continue higher above the $19,350 resistance zone, it could start a fresh decline. An immediate support on the downside is near the $18,800 zone.
The next major support is near the $18,550 level. A clear move below the $18,550 zone could set the pace for a larger decline. In the stated case, the price may even decline below the $18,223 swing low.
Technical indicators:
Hourly MACD – The MACD is now losing pace in the bullish zone.
Hourly RSI (Relative Strength Index) – The RSI for BTC/USD is now near the 50 level.
Major Support Levels – $18,800, followed by $18,550.
Major Resistance Levels – $19,200, $19,350 and $19,500.