

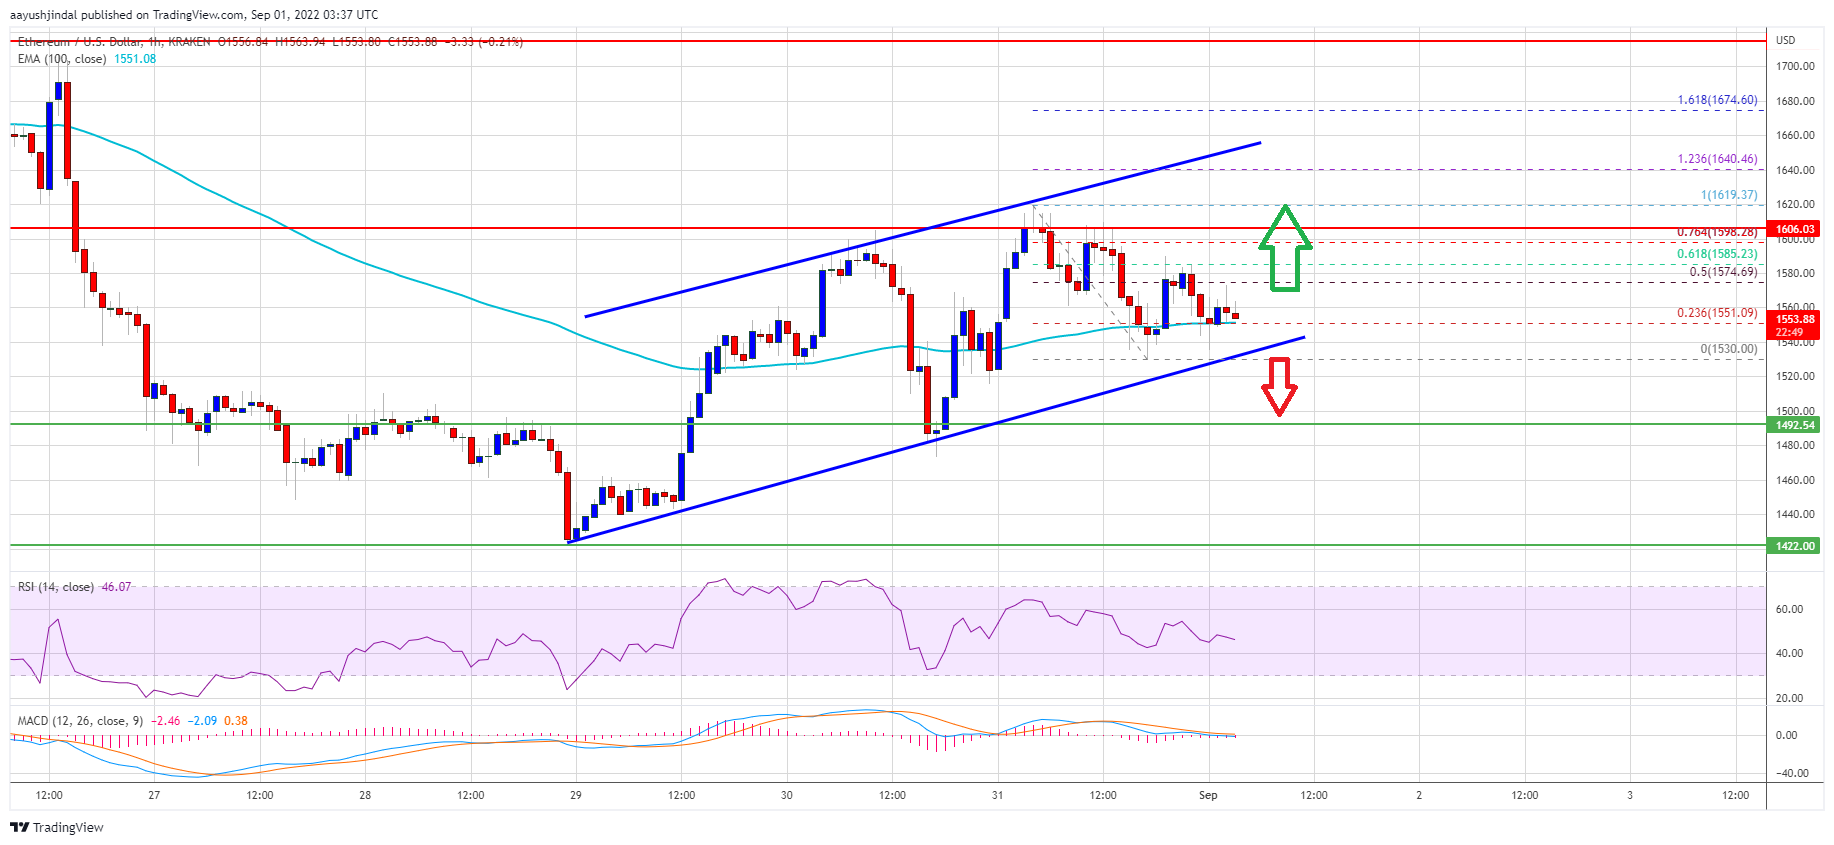
Ethereum failed to stay above the $1,600 resistance against the US Dollar. ETH is correcting lower and must stay above $1,540 to continue higher.
- Ethereum failed to clear the $1,620 and $1,625 resistance levels.
- The price is now trading near $1,550 and the 100 hourly simple moving average.
- There is a major rising channel forming with support near $1,540 on the hourly chart of ETH/USD (data feed via Kraken).
- The pair could start another increase if it stays above the $1,540 and $1,500 support levels.
Ethereum Price Remains Supported
Ethereum attempted an upside break above the $1,620 level, but struggled. The bears were active near the $1,620 zone and the price started a downside correction.
A high was formed near $1,619 before the price corrected lower. There was a drop below the $1,560 level and the 100 hourly simple moving average. However, the bulls were active near the $1,530 and $1,525 levels. A low was formed near $1,530 and the price is now consolidating.
There was a move above $1,550 and the 100 hourly simple moving average. The price climbed above the 50% Fib retracement level of the recent decline from the $1,619 swing high to $1,530 low.
It is now consolidating near $1,550 and the 100 hourly simple moving average. There is also a major rising channel forming with support near $1,540 on the hourly chart of ETH/USD. It is facing resistance near the $1,580 and $1,585 levels.
The 61.8% Fib retracement level of the recent decline from the $1,619 swing high to $1,530 low is also near the $1,585 level. The next major resistance is now forming near the $1,620 level.
Source: ETHUSD on TradingView.com
A clear move above the $1,620 level might send the price towards $1,650 resistance. Any more gains may perhaps open the doors for a test of the $1,700 resistance in the near term.
Fresh Decline in ETH?
If ethereum fails to rise above the $1,585 resistance, it could start another decline. An initial support on the downside is near the $1,540 zone and the channel trend line.
The next major support is near $1,500, below which ether price might gain bearish momentum. In the stated case, the price may perhaps decline towards the $1,425 level. Any more losses may perhaps send the price towards the $1,380 zone.
Technical Indicators
Hourly MACD – The MACD for ETH/USD is now losing momentum in the bullish zone.
Hourly RSI – The RSI for ETH/USD is now below the 50 level.
Major Support Level – $1,540
Major Resistance Level – $1,585