

Bitcoin traded close to $25,000 before it corrected lower against the US Dollar. BTC must stay above the $23,500 support to start another increase.
- Bitcoin started a fresh increase above the $24,000 resistance zone.
- The price is now trading above the $23,600 level and the 100 hourly simple moving average.
- There was a break below a major bullish trend line with support near $24,000 on the hourly chart of the BTC/USD pair (data feed from Kraken).
- The pair is now approaching a major support zone near $23,600 and $23,500.
Bitcoin Price Corrects Lower
Bitcoin price gained pace after there was a clear move above the $24,000 resistance zone. BTC broke the $24,200 level to move further into a positive zone.
The price even climbed above the $24,500 level and traded close to the $25,000 level. A high was formed near $24,900 and the price started a downside correction. There was a move below the $24,500 support level.
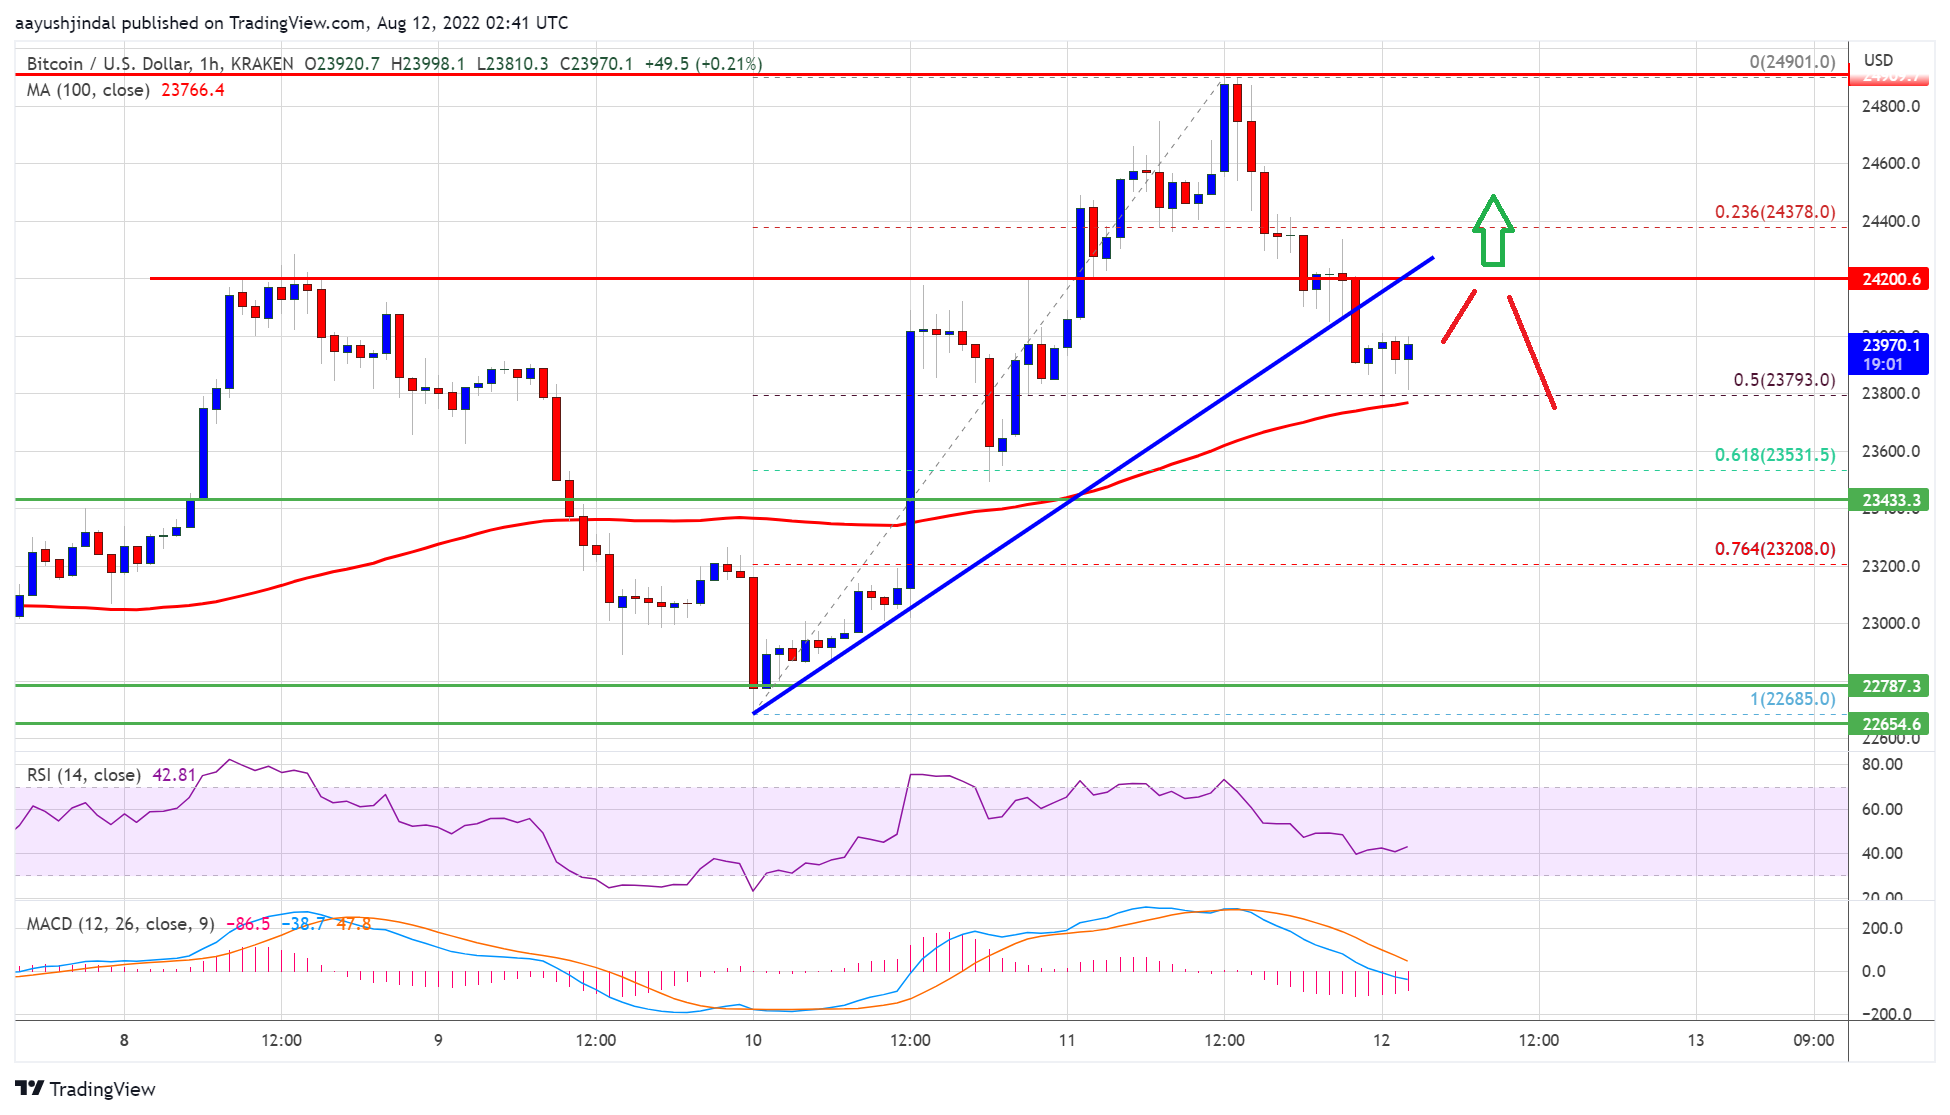
Besides, there was a break below a major bullish trend line with support near $24,000 on the hourly chart of the BTC/USD pair. Bitcoin price even traded below the 23.6% Fib retracement level of the upward move from the $22,686 swing low to $24,901 high.
However, the price is now trading above the $23,600 level and the 100 hourly simple moving average. On the upside, an immediate resistance is near the $24,200 level.
Source: BTCUSD on TradingView.com
The next key resistance is near the $24,500 zone. A close above the $24,500 resistance zone could start another increase. In the stated case, the price may perhaps test the $25,000 resistance.
Dips Limited in BTC?
If bitcoin fails to clear the $24,200 resistance zone, it could continue to move down. An immediate support on the downside is near the $23,800 level and the 100 hourly SMA.
It is near the 50% Fib retracement level of the upward move from the $22,686 swing low to $24,901 high. The next major support now sits near the $23,500 level. If the bears push the price below the $23,500 support level, there might be a move towards the $23,000 level. Any more losses might send the price towards $22,500 level.
Technical indicators:
Hourly MACD – The MACD is now losing pace in the bearish zone.
Hourly RSI (Relative Strength Index) – The RSI for BTC/USD is now below the 50 level.
Major Support Levels – $23,800, followed by $23,500.
Major Resistance Levels – $24,200, $24,500 and $25,000.