

Bitcoin price found support above $22,500 and surged over 6% against the US Dollar. BTC broke many hurdles and might rise further towards the $25,000 resistance.
- Bitcoin started a fresh increase after it found strong bids above $22,500.
- The price is now trading above the $23,500 level and the 100 hourly simple moving average.
- There was a break above a key bearish trend line with resistance near $23,350 on the hourly chart of the BTC/USD pair (data feed from Kraken).
- The pair is forming a bullish breakout pattern and might rise towards $25,000.
Bitcoin Price Breaks Resistance
Bitcoin price remained well supported above the $22,500 zone. BTC formed a double bottom pattern near the $22,500 level and started a strong increase.
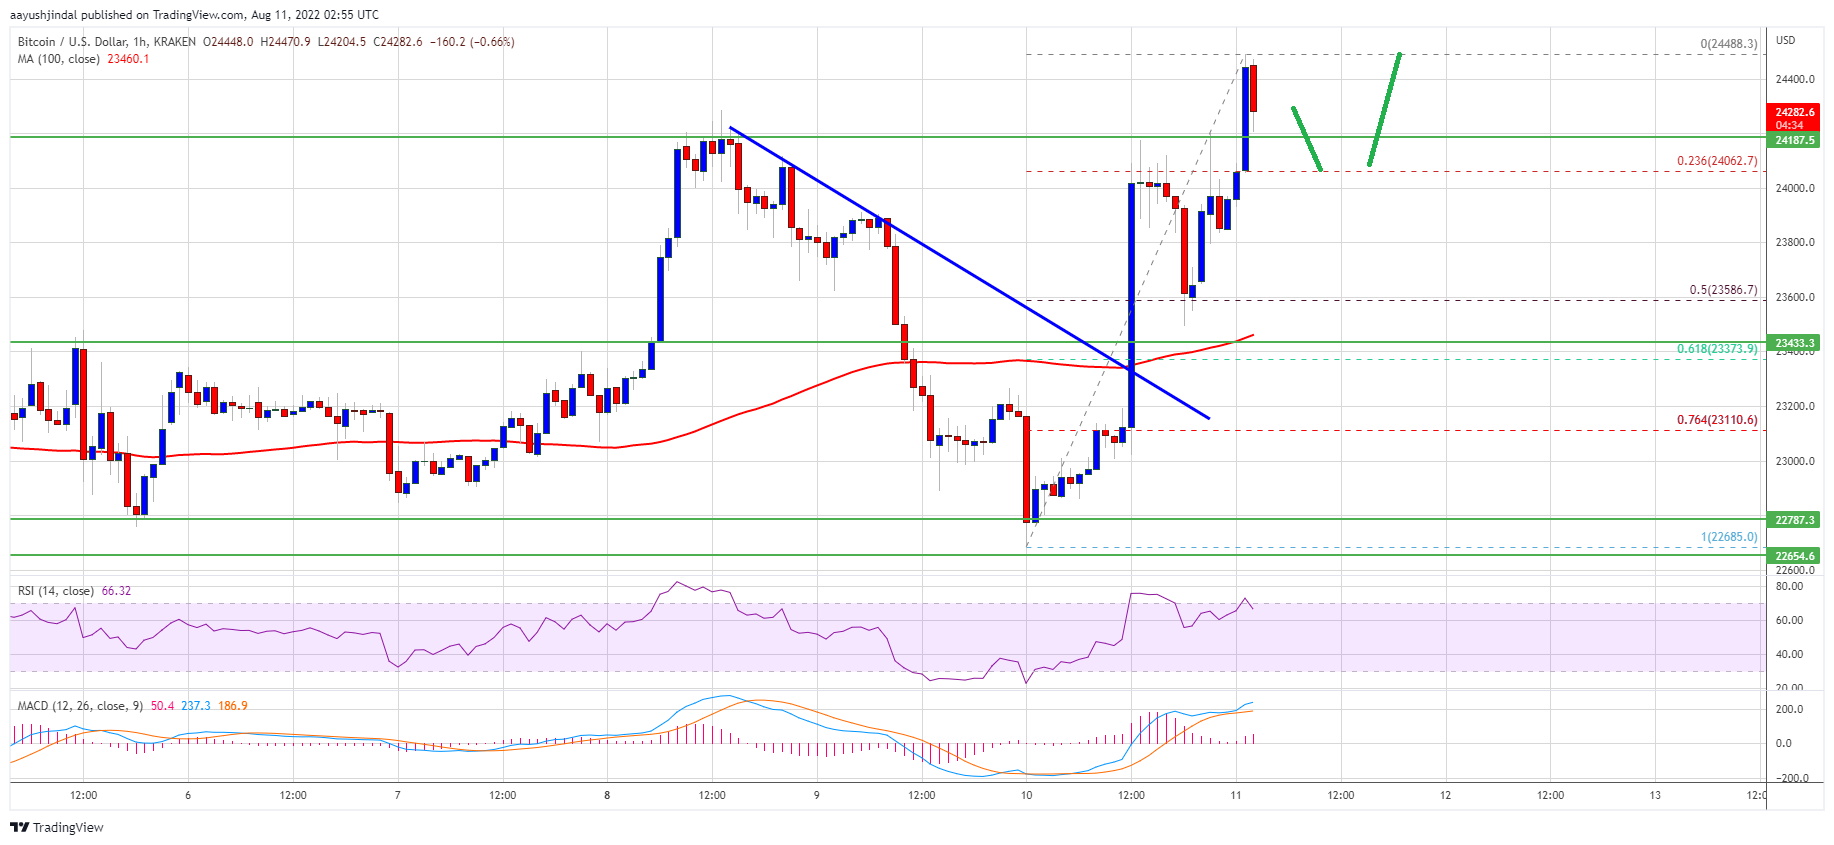
There was a move above the $23,000 and $23,500 resistance levels. The price even surged above the $24,000 resistance. There was a break above a key bearish trend line with resistance near $23,350 on the hourly chart of the BTC/USD pair.
Bitcoin price even broke the $24,200 resistance and traded as high as $24,488. It is now consolidating gains above the $24,200 support zone. It is also well above the 23.6% Fib retracement level of the upward move from the $22,685 swing low to $24,488 high.
Source: BTCUSD on TradingView.com
On the upside, an immediate resistance is near the $24,450 level. The next key resistance is near the $24,500 zone. A close above the $24,500 resistance zone could start another increase. In the stated case, the price may perhaps rise towards the $25,000 resistance.
Dips Limited in BTC?
If bitcoin fails to clear the $24,500 resistance zone, it could correct lower. An immediate support on the downside is near the $24,200 level. The next major support now sits near the $24,000 level.
If the bears push the price below the $24,000 support level, there might be a move towards the $23,550 level. It is near the 50% Fib retracement level of the upward move from the $22,685 swing low to $24,488 high. Any more losses might send the price towards $23,450 level or the 100 hourly simple moving average.
Technical indicators:
Hourly MACD – The MACD is now losing pace in the bullish zone.
Hourly RSI (Relative Strength Index) – The RSI for BTC/USD is now well above the 50 level.
Major Support Levels – $24,200, followed by $23,500.
Major Resistance Levels – $24,450, $24,500 and $25,000.