

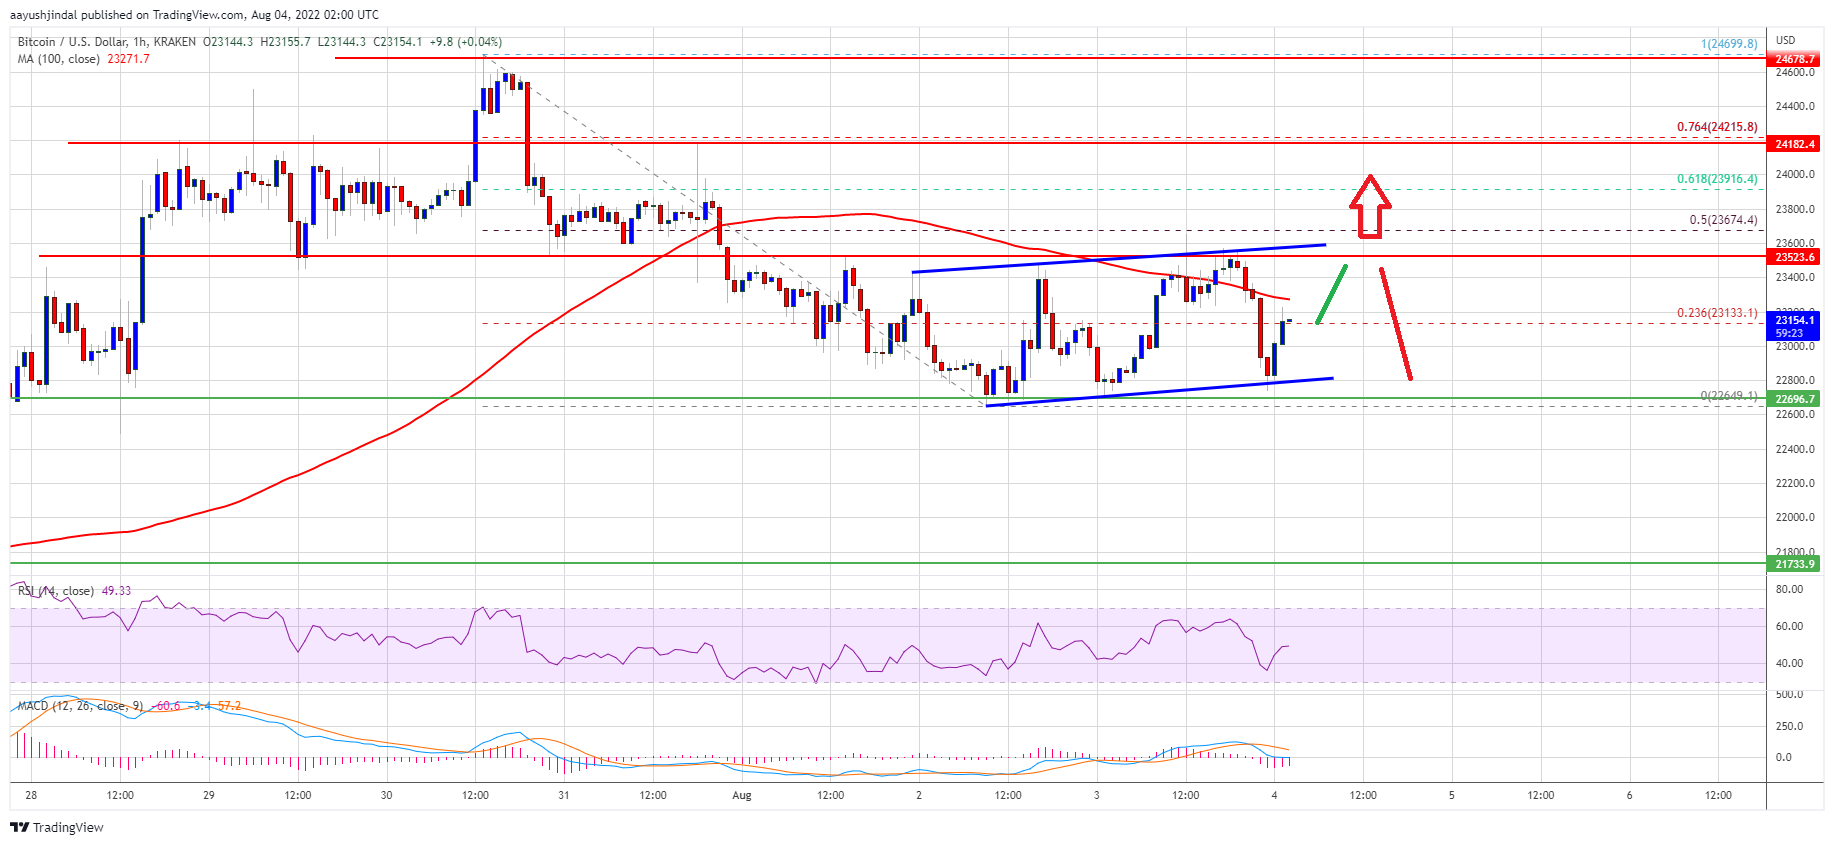
Bitcoin is facing a key resistance near the $23,500 zone against the US Dollar. BTC must clear $23,500 to avoid a fresh bearish reaction in the near term.
- Bitcoin is struggling to rise and trading below the $23,500 level.
- The price is now trading below the $23,200 level and the 100 hourly simple moving average.
- There is a key rising channel forming with support near $22,800 on the hourly chart of the BTC/USD pair (data feed from Kraken).
- The pair must clear the $23,500 resistance to start a decent increase in the near term.
Bitcoin Price Upsides Capped
Bitcoin price gained pace after it broke the $23,500 support zone. The price even traded below the $23,000 level to move into a short-term bearish zone.
However, the bulls protected the $22,650 zone. The 50% Fib retracement level of the upward move from the $20,692 swing low to $24,671 high acted as a support. The price formed a base and recently recovered losses above the $23,000 level.
Bitcoin climbed above the 23.6% Fib retracement level of the downward move from the $24,699 swing high to $22,649 low. The price even spiked above the $23,400 level, but it faced a strong resistance near $23,500.
It is now trading below the $23,200 level and the 100 hourly simple moving average. There is also a key rising channel forming with support near $22,800 on the hourly chart of the BTC/USD pair. On the upside, bitcoin price is facing resistance near the $23,200 level and the 100 hourly SMA.
Source: BTCUSD on TradingView.com
The next key resistance is near the $23,500 zone. A close above the $23,500 resistance zone could set the pace for a decent increase. In the stated case, the price may perhaps rise towards the $24,215 level. The next major resistance sits near the $24,700 level.
More Losses in BTC?
If bitcoin fails to clear the $23,500 resistance zone and the channel resistance, it could continue to move down. An immediate support on the downside is near the $22,800 level.
The next major support now sits near the $22,640 level. A close below the $22,640 level might spark a sharp decline to $21,750. Any more losses might send the price towards $21,000 level.
Technical indicators:
Hourly MACD – The MACD is now gaining pace in the bearish zone.
Hourly RSI (Relative Strength Index) – The RSI for BTC/USD is now near the 50 level.
Major Support Levels – $22,800, followed by $22,500.
Major Resistance Levels – $23,200, $23,500 and $24,180.