

Bitcoin started a steady increase above the $21,000 resistance against the US Dollar. BTC could rise further towards $22,000 if it stays above the $20,500 support.
- Bitcoin is slowly moving higher above the $21,000 resistance zone.
- The price is now trading above the $20,800 level and testing the 100 hourly simple moving average.
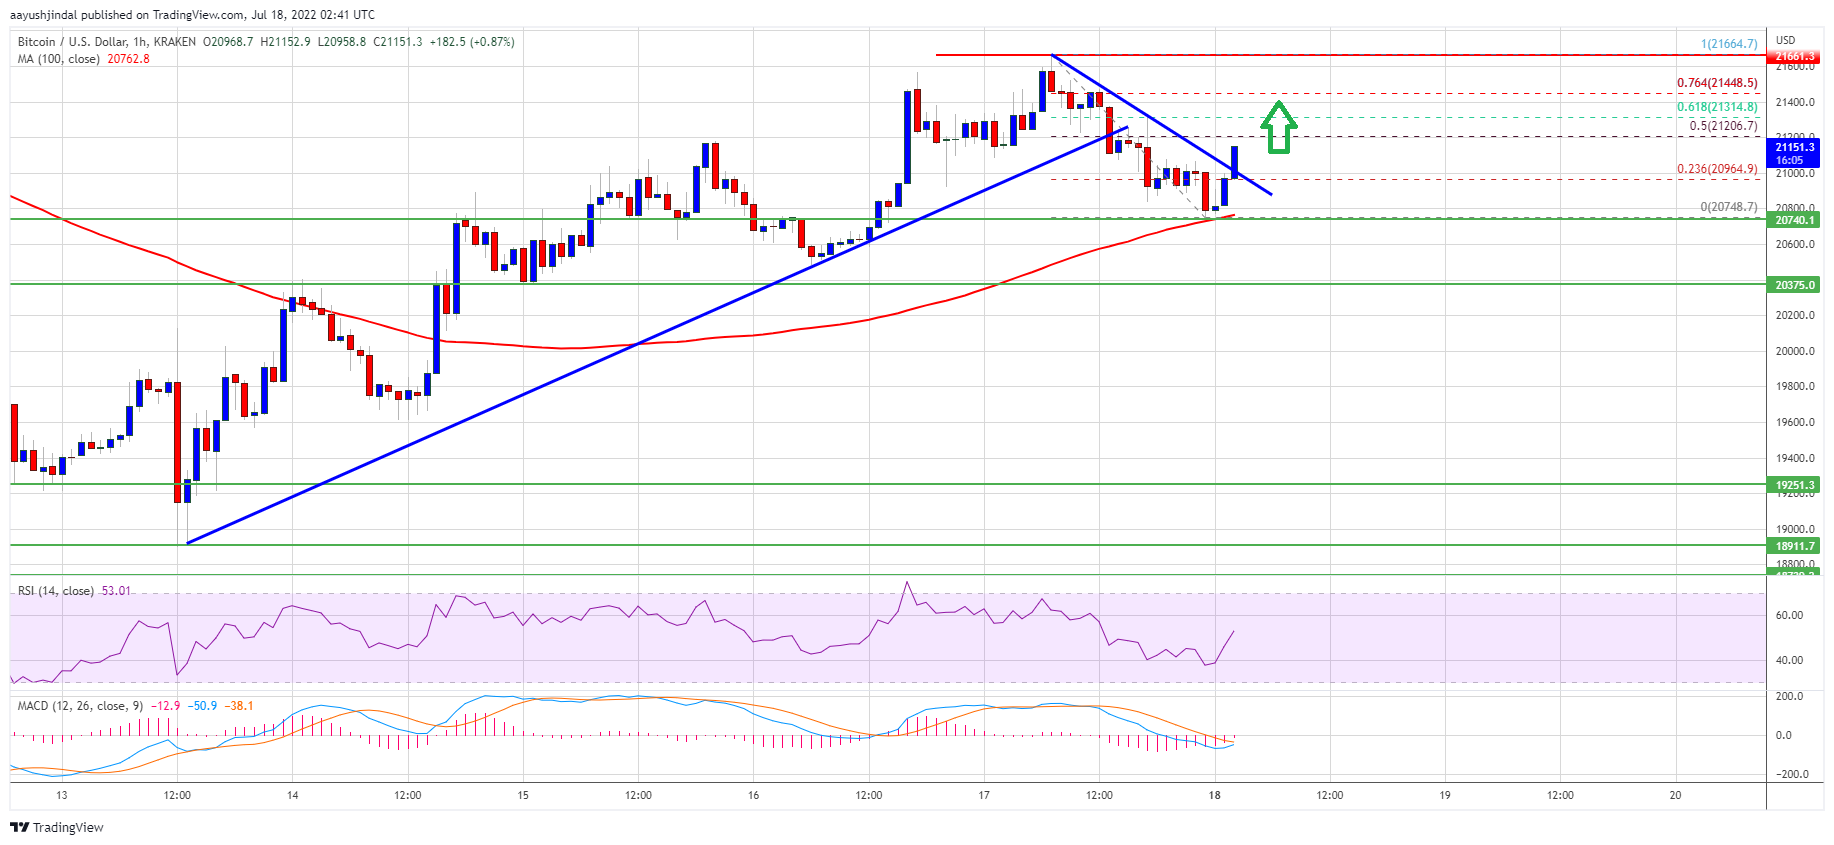
- There was a break above a short-term bearish trend line with resistance near $21,000 on the hourly chart of the BTC/USD pair (data feed from Kraken).
- The pair might gain bullish momentum if it clears the $21,500 and $21,600 levels.
Bitcoin Price Shows Positive Signs
Bitcoin price formed a base above the $19,200 level and started a decent increase. The price traded above the $20,500 resistance zone to move into a positive zone.
The price even gained pace above the $21,000 level and settled above the 100 hourly simple moving average. A high was formed near $21,664 before there was a downside correction. The price traded below the $21,000 level, but the bulls were active near the $20,750 zone and the 100 hourly simple moving average.
A low was formed near $20,748 and the price is now rising. It broke the 23.6% Fib retracement level of the downward move from the $21,664 swing high to $20,748 low.
There was also a break above a short-term bearish trend line with resistance near $21,000 on the hourly chart of the BTC/USD pair. On the upside, bitcoin price could resistance near the $21,200 level. It is near the 50% Fib retracement level of the downward move from the $21,664 swing high to $20,748 low.
Source: BTCUSD on TradingView.com
The next key resistance is near the $21,500 zone. A close above the $21,500 resistance zone could set the pace for a decent increase. In the stated case, the price may perhaps rise towards the $22,000 level. The next major resistance sits near the $22,800 level.
Dips Supported in BTC?
If bitcoin fails to clear the $21,500 resistance zone, it could start a downside correction. An immediate support on the downside is near the $21,000 level.
The next major support now sits near the $20,750 level and the 100 hourly SMA. A clear move below the $20,750 support might send the price towards $20,500.
Technical indicators:
Hourly MACD – The MACD is now gaining pace in the bullish zone.
Hourly RSI (Relative Strength Index) – The RSI for BTC/USD is now above the 50 level.
Major Support Levels – $21,000, followed by $20,750.
Major Resistance Levels – $21,200, $21,500 and $22,000.