

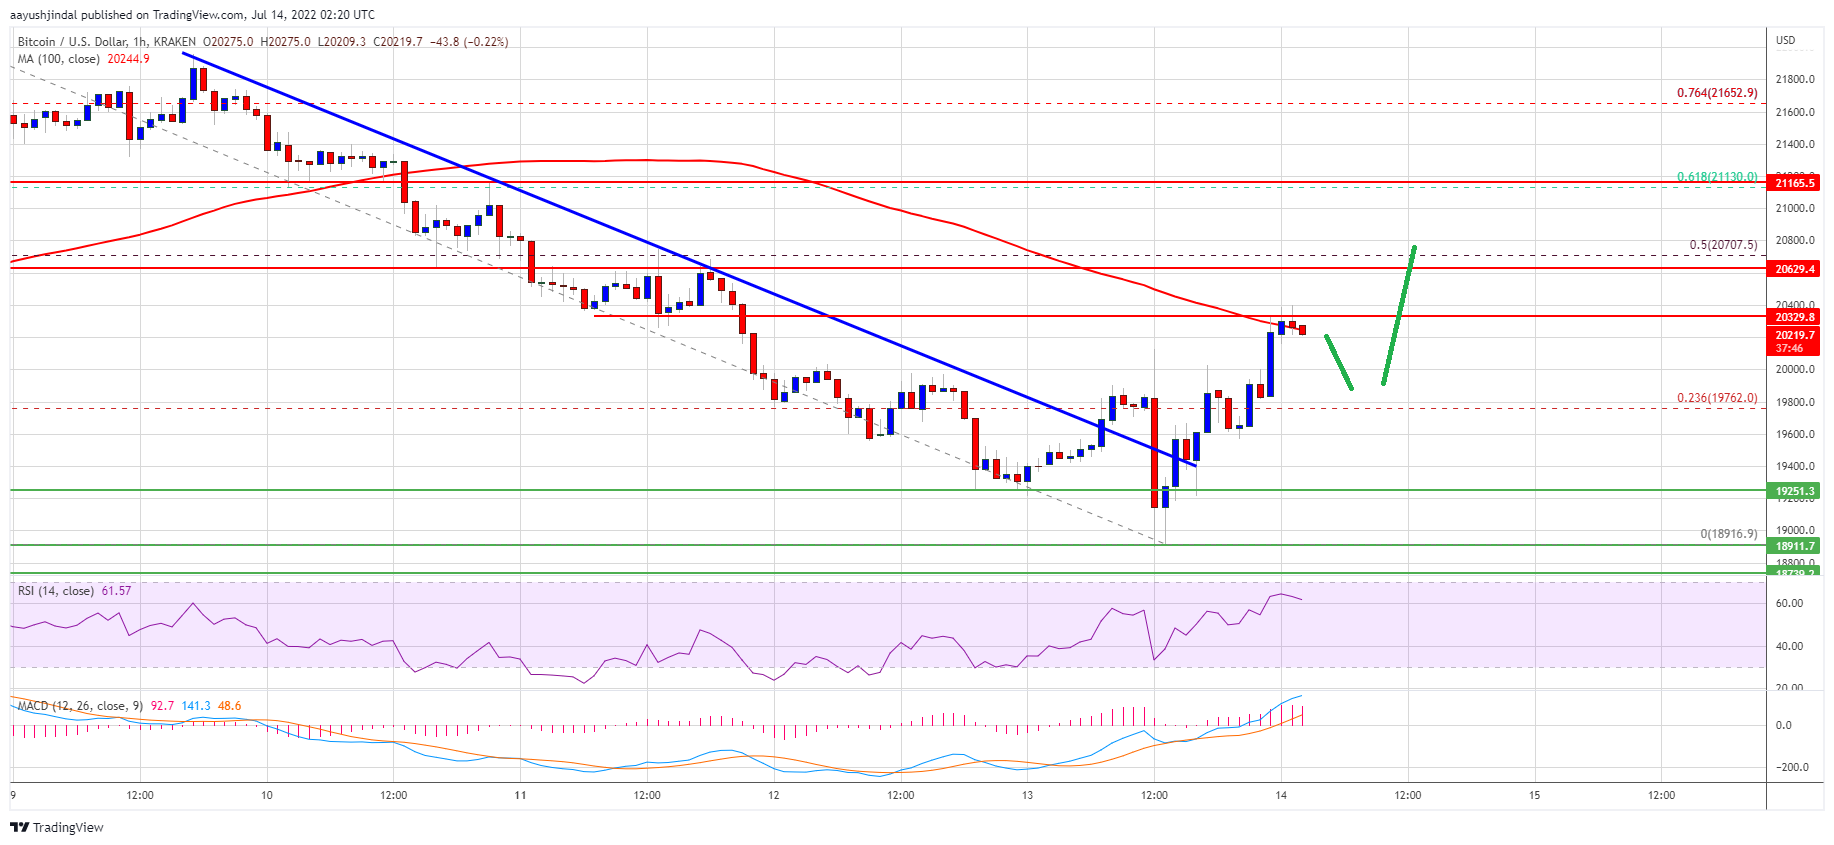
Bitcoin extended losses and traded below $19,200 against the US Dollar. BTC found support near $19,000 and started an upside correction.
- Bitcoin traded as low as $18,916 and started an upside correction.
- The price is now trading above the $20,000 level and testing the 100 hourly simple moving average.
- There was a break above a key bearish trend line with resistance near $19,400 on the hourly chart of the BTC/USD pair (data feed from Kraken).
- The pair might gain bullish momentum if it clears the 100 hourly SMA and $20,600.
Bitcoin Price Recovers Above $20K
Bitcoin price started a fresh decline below the $20,000 support zone. The price even broke the $19,600 and $19,250 support levels.
Finally, there was a spike below the $19,000 level. A low was formed near $18,916 and the price is now correcting losses. There was a steady move above the $19,250 and $19,500 levels. The bulls pumped the price above the 23.6% Fib retracement level of the downward move from the $22,499 swing high to $18,916 low.
Besides, there was a break above a key bearish trend line with resistance near $19,400 on the hourly chart of the BTC/USD pair. The price even climbed above the $20,000 resistance level.
Bitcoin is now trading above the $20,000 level and testing the 100 hourly simple moving average. It seems to be facing resistance near the $20,350 level. On the upside, the price could resistance near the $20,600 level. The next key resistance is near the $20,700 zone.
The 50% Fib retracement level of the downward move from the $22,499 swing high to $18,916 low is also near the $20,700 level. A close above the $20,700 resistance zone could set the pace for a decent increase.
Source: BTCUSD on TradingView.com
In the stated case, the price may perhaps rise towards the $21,650 level. The next major resistance sits near the $22,000 level.
Fresh Decline in BTC?
If bitcoin fails to start a recovery wave above the $20,600 level, it could start a fresh decline. An immediate support on the downside is near the $20,000 level.
The next major support now sits near the $19,500 level. A close below the $19,500 support zone could accelerate losses. In the stated case, there is a risk of a move towards the $18,800 level.
Technical indicators:
Hourly MACD – The MACD is now gaining pace in the bullish zone.
Hourly RSI (Relative Strength Index) – The RSI for BTC/USD is now above the 50 level.
Major Support Levels – $20,000, followed by $19,500.
Major Resistance Levels – $20,350, $20,600 and $20,700.