

Bitcoin trimmed gains and declined below $21,000 against the US Dollar. BTC must stay above $20,500 to avoid a major decline in the near term.
- Bitcoin failed to stay above the $21,000 support and extended drop.
- The price is now trading below the $21,500 level and the 100 hourly simple moving average.
- There is a major bullish trend line forming with support near $20,520 on the hourly chart of the BTC/USD pair (data feed from Kraken).
- The pair could start another major decline if there is a clear move below $20,500.
Bitcoin Price Reaches Support
Bitcoin price attempted a close above the $22,000 level, but the bears remained active. As a result, there was a slow and steady decline below the $21,500 level.
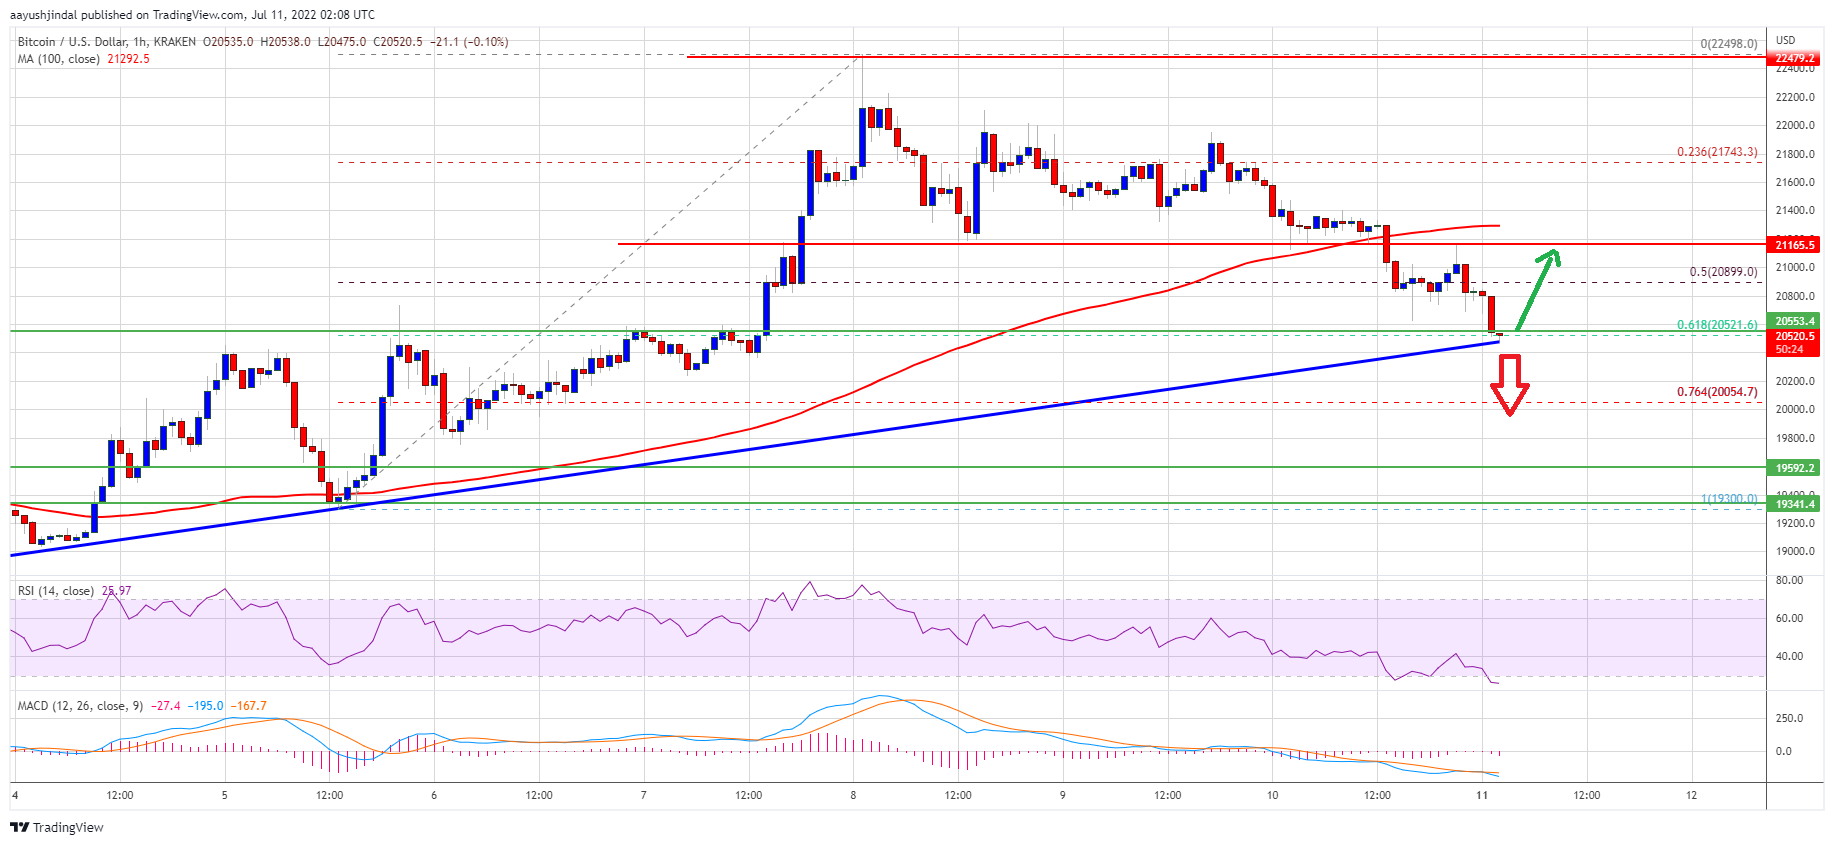
The price declined below the 50% Fib retracement level of the upward move from the $19,300 swing low to $22,498 high. The price is now trading below the $21,500 level and the 100 hourly simple moving average.
It is testing the key $20,500 support zone. There is also a major bullish trend line forming with support near $20,520 on the hourly chart of the BTC/USD pair. The trend line is near the 61.8% Fib retracement level of the upward move from the $19,300 swing low to $22,498 high.
If bitcoin price stays above the trend line, it could correct above $20,800. On the upside, the price is facing resistance near the $20,800 and $20,850 levels.
Source: BTCUSD on TradingView.com
The next key resistance is near the $21,250 zone and the 100 hourly simple moving average. A close above the $21,250 resistance zone could set the pace for a test of the $22,000 level. Any more gains might open the doors for an increase towards the $22,500 level. The next major resistance sits near the $23,200 level.
Downside Break in BTC?
If bitcoin fails to stay above the trend line support, it could continue to move down below $20,500. An immediate support on the downside is near the $20,050 level.
The next major support now sits near the $19,600 level or the last swing low. A close below the $19,600 support zone could push the price to $19,000. In the stated case, there is a risk of a move towards the $18,500 level.
Technical indicators:
Hourly MACD – The MACD is now gaining pace in the bearish zone.
Hourly RSI (Relative Strength Index) – The RSI for BTC/USD is now in the oversold zone.
Major Support Levels – $20,500, followed by $20,000.
Major Resistance Levels – $20,800, $21,250 and $22,000.